Gallery#
Also visit the Examples HoloViz Gallery to discover a curated collection of domain-specific narrative examples using HoloViews and various HoloViz projects.
Applications#
Crossfilter
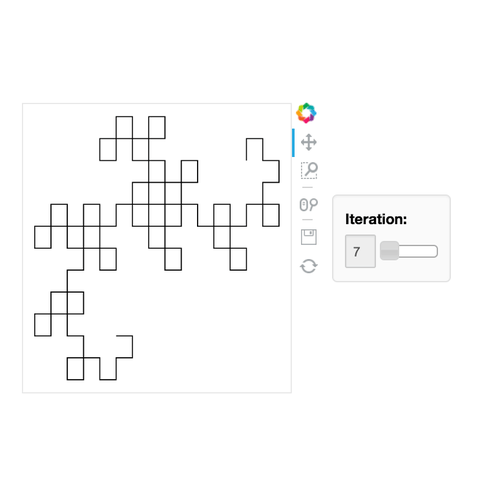
Game Of Life
Gapminder
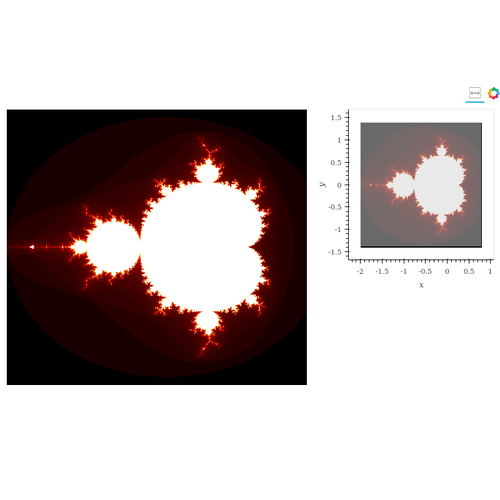
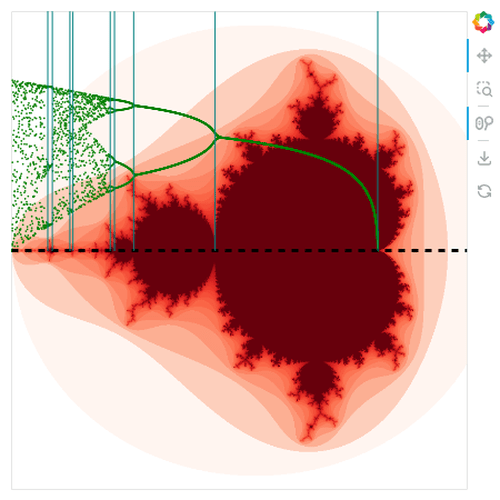
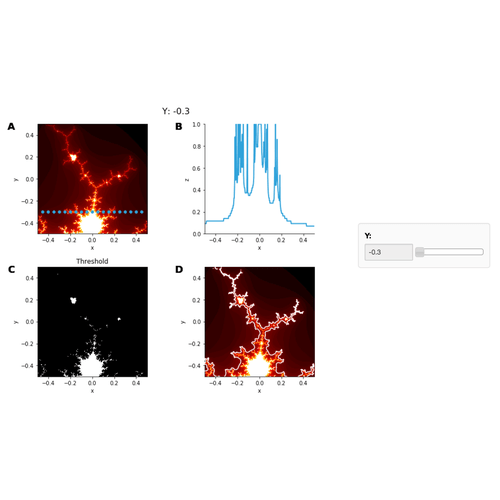
Mandelbrot
Nytaxi Hover
Streaming Psutil
Demos#
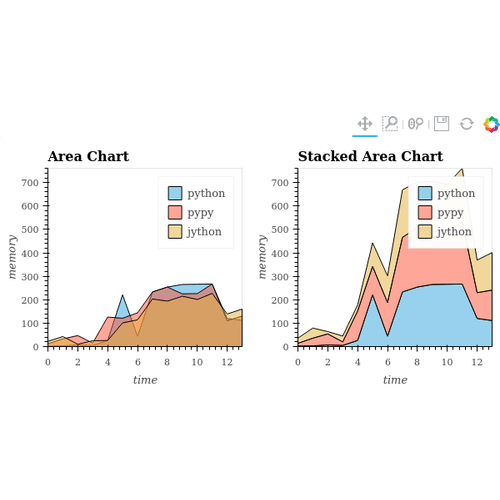
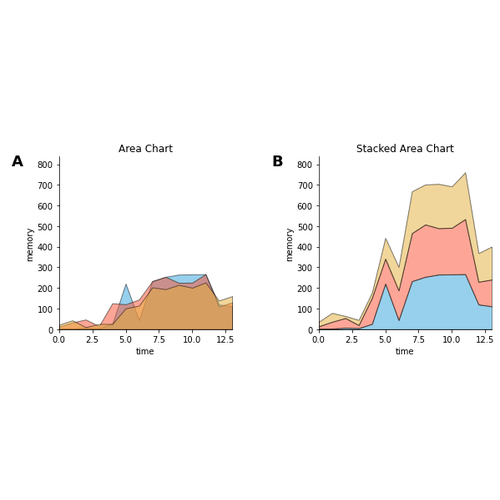
Area Chart
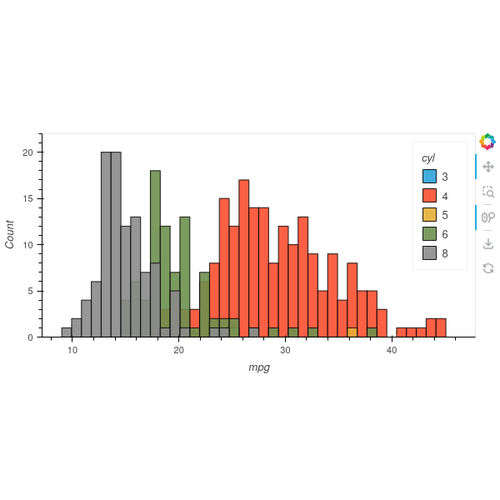
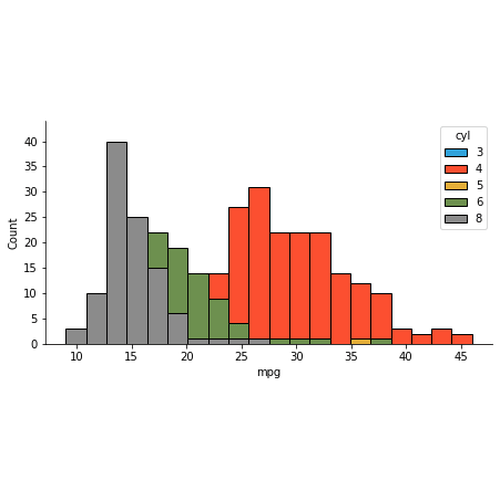
Autompg Histogram
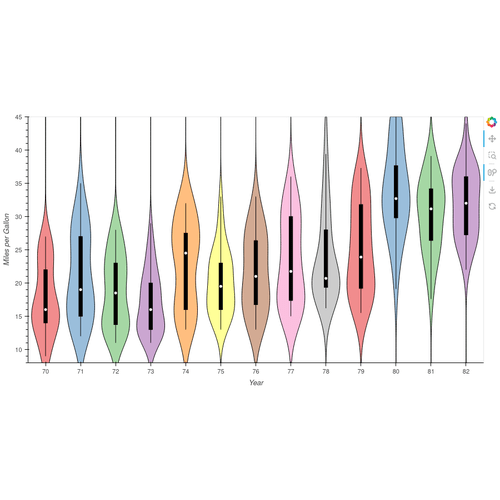
Autompg Violins
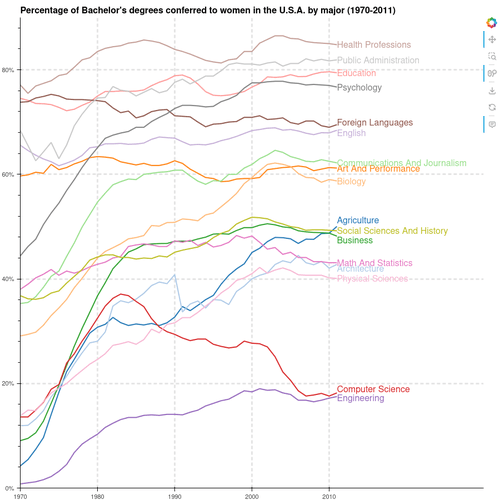
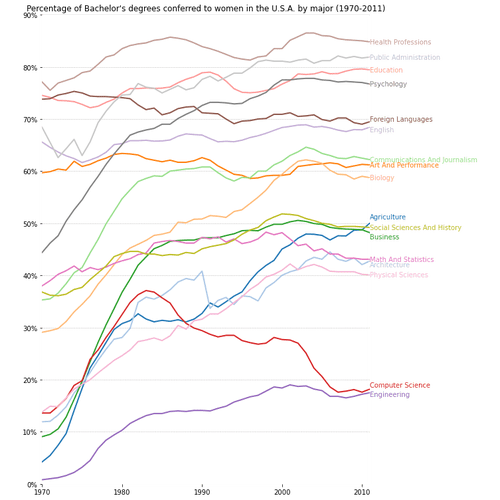
Bachelors Degrees By Gender
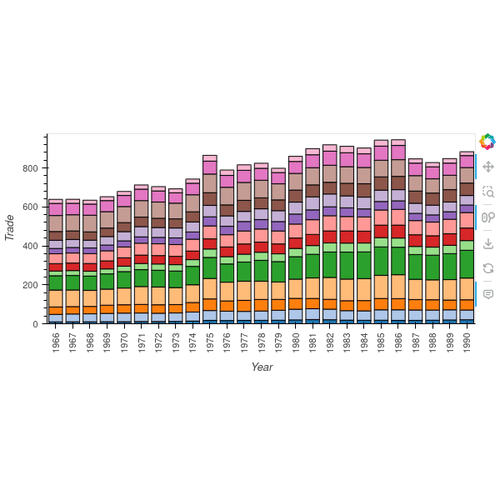
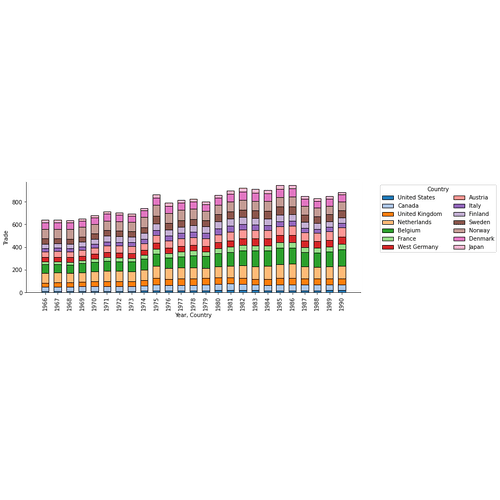
Bars Economic
Box Draw Roi Editor
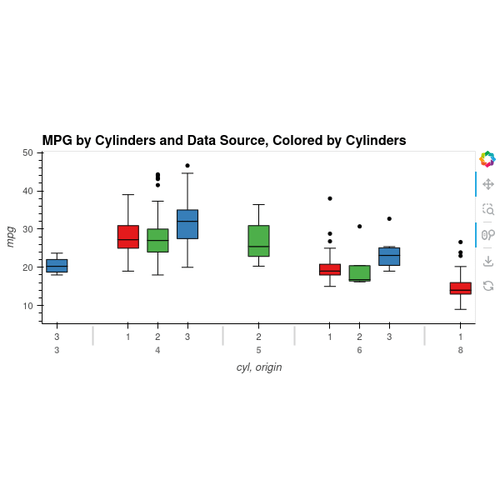
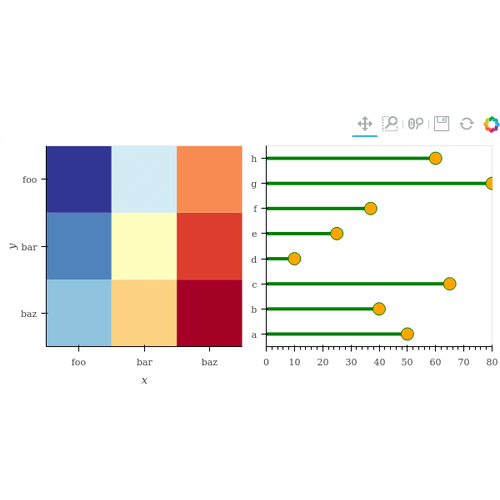
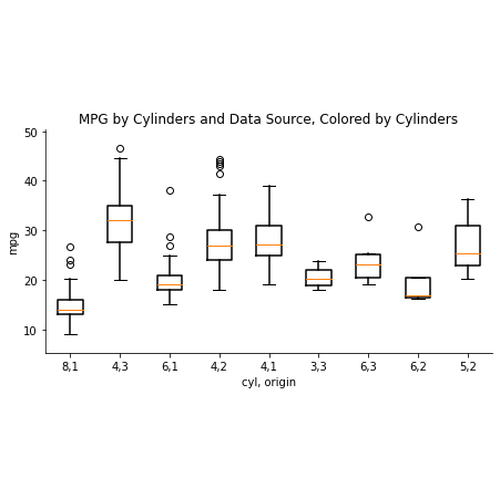
Boxplot Chart
Choropleth Data Link
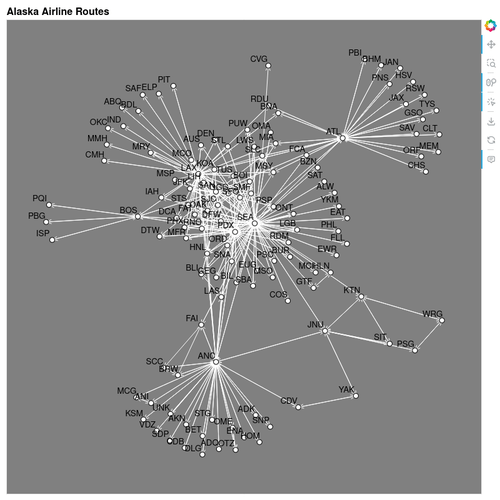
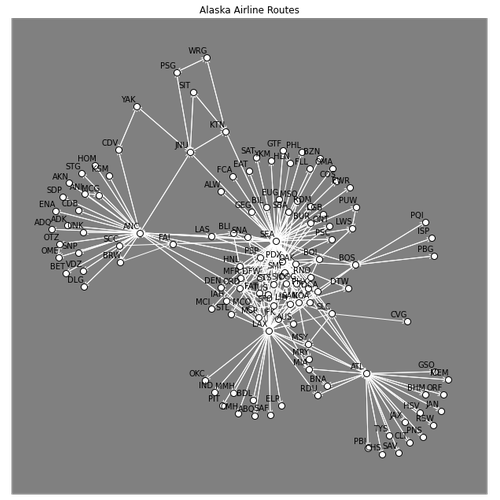
Directed Airline Routes
Dot Example
Dragon Curve
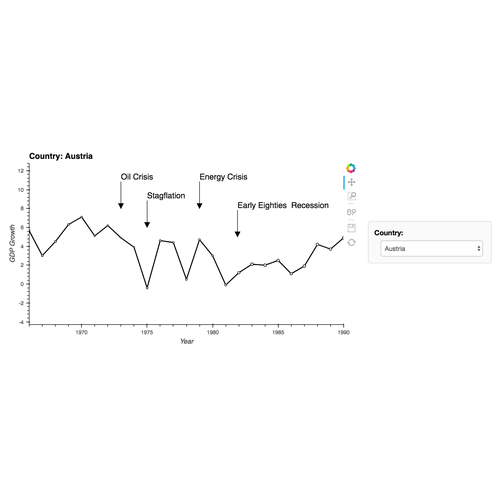
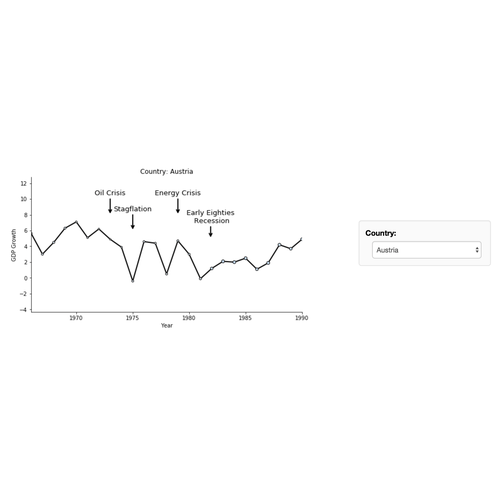
Dropdown Economic
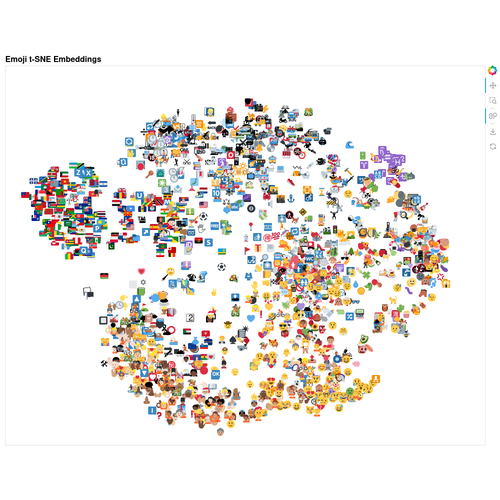
Emoji Tsne
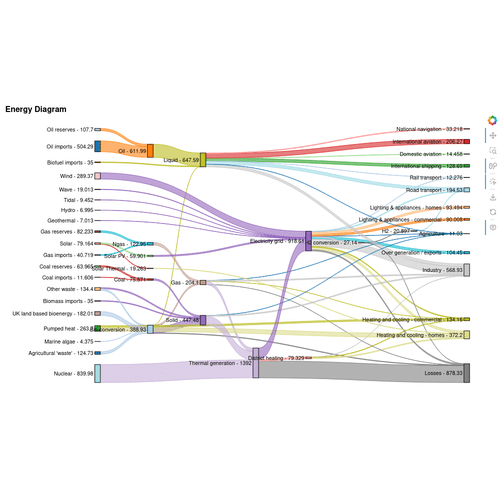
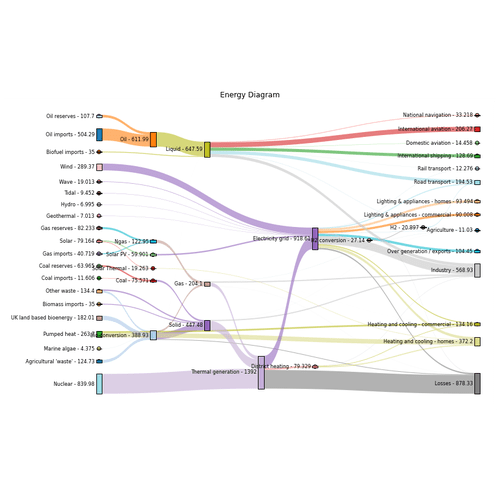
Energy Sankey
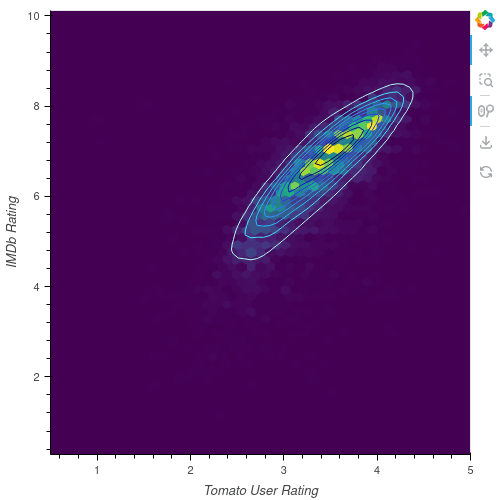
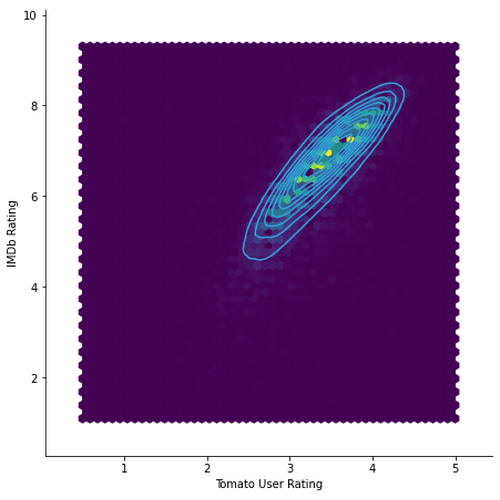
Hextile Movie Ratings
Histogram Example
Html Hover Tooltips
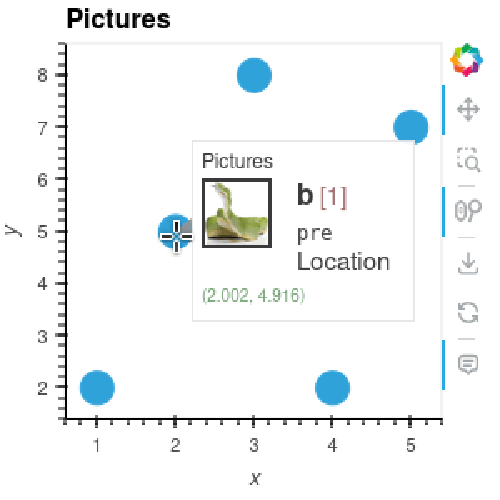
Image Range Tool
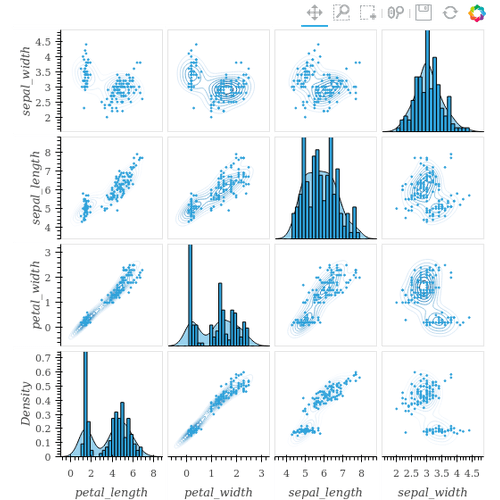
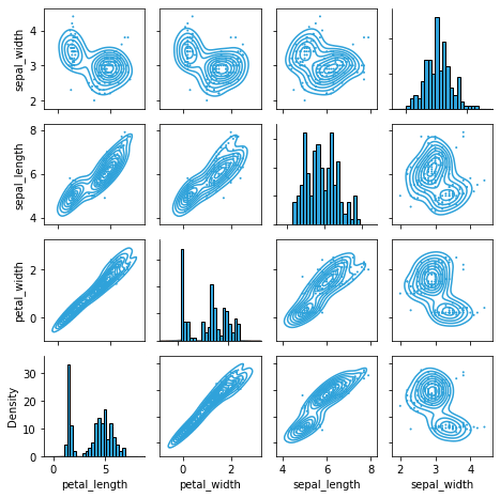
Iris Density Grid
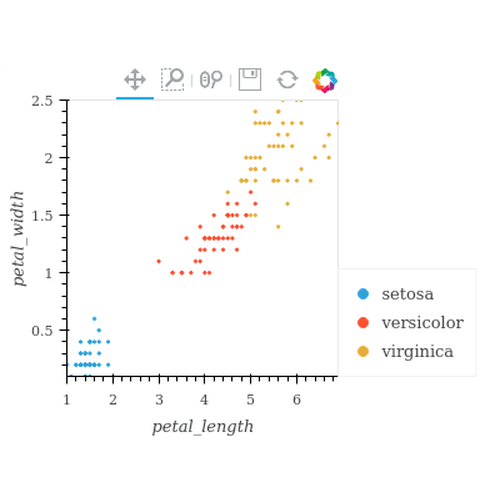
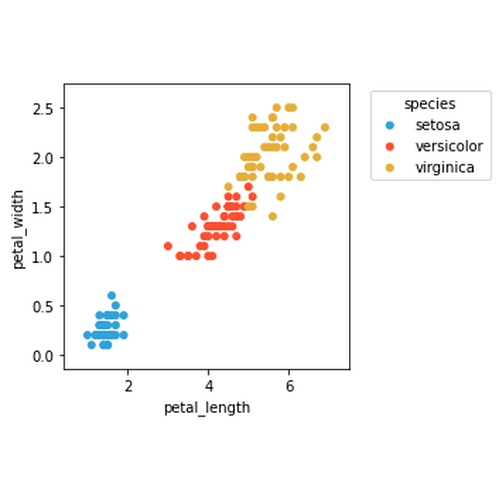
Iris Example
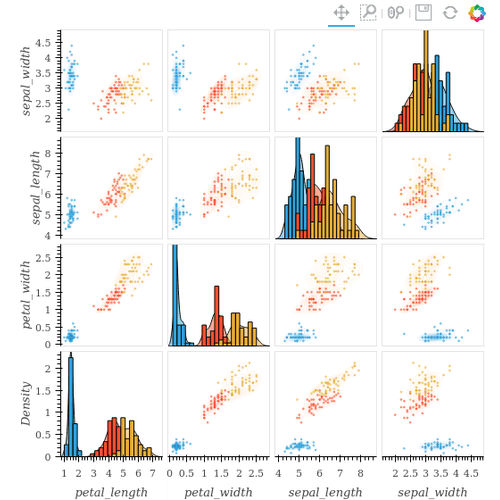
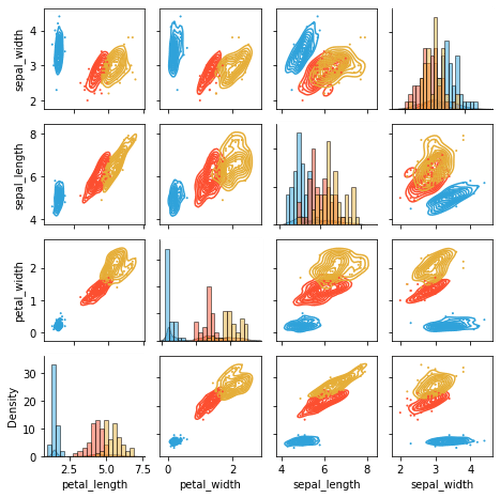
Iris Grouped Grid
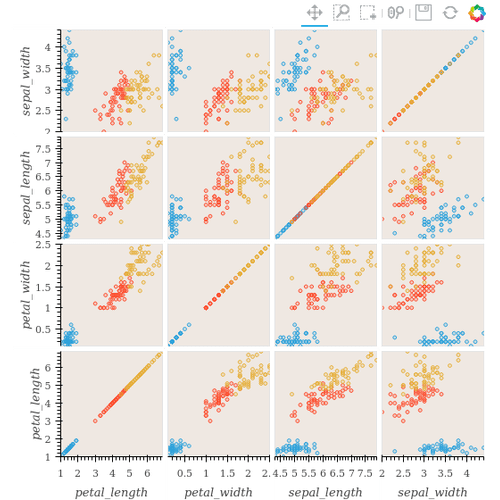
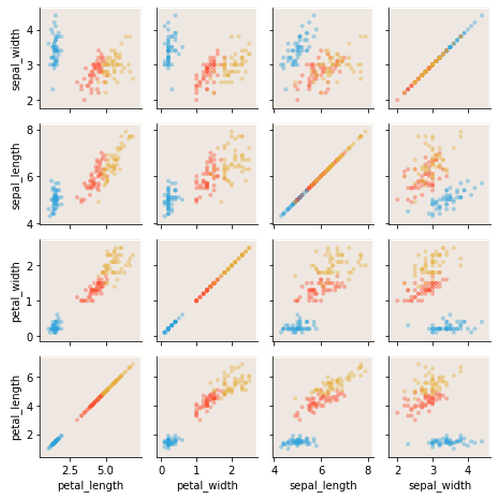
Iris Splom Example
Irregular Quadmesh
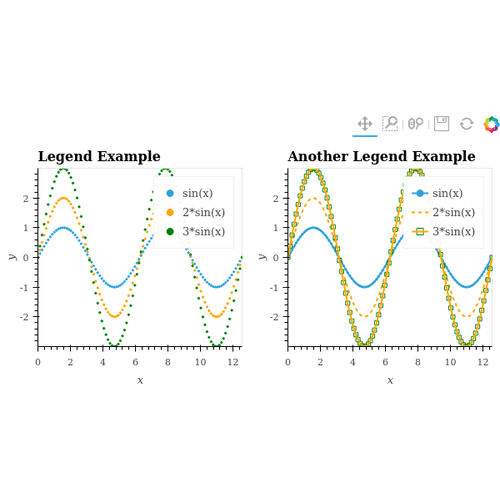
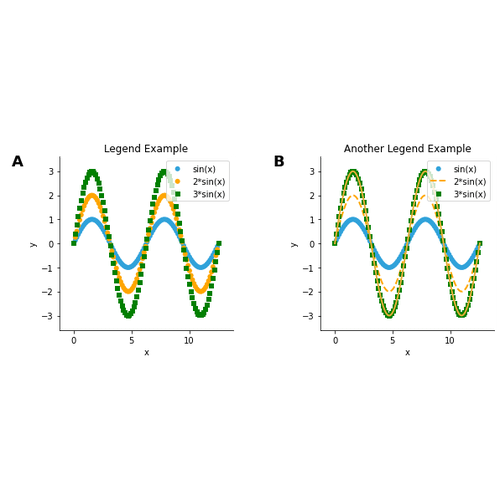
Legend Example
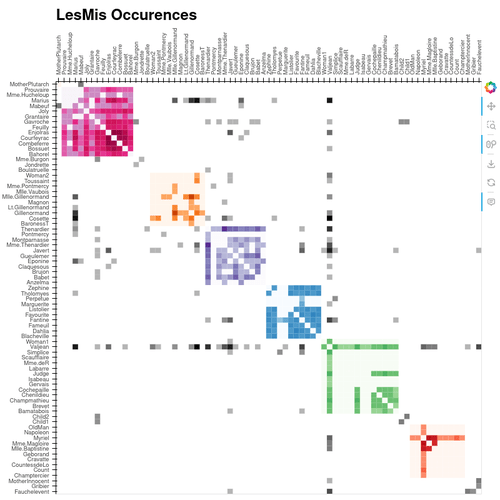
Lesmis Example
Life Expectancy Split Violin

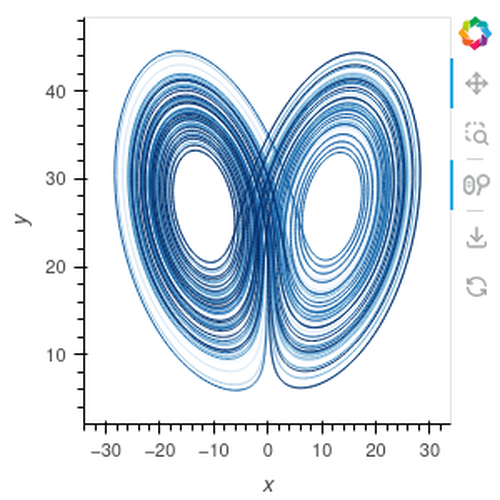
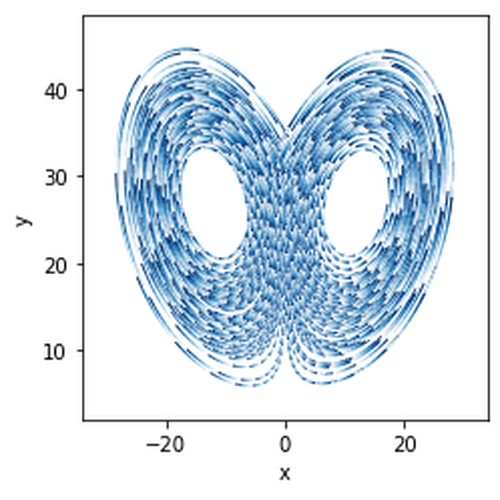
Lorenz Attractor Example
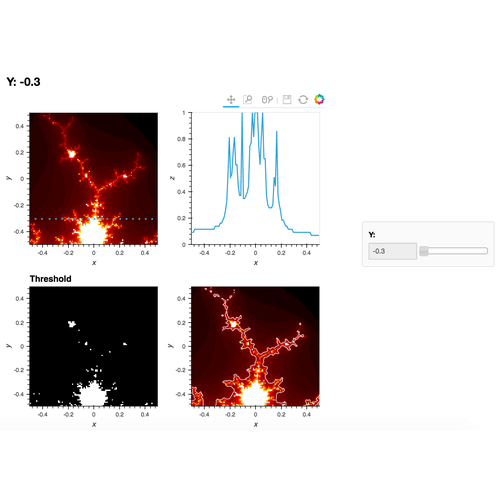
Mandelbrot Section
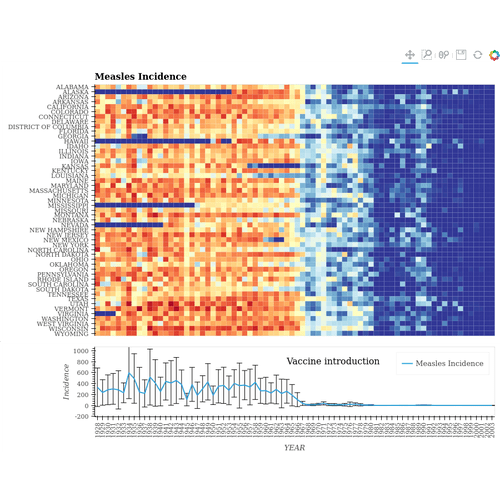
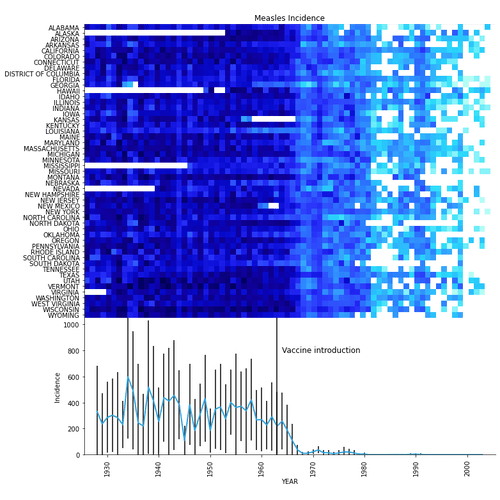
Measles Example
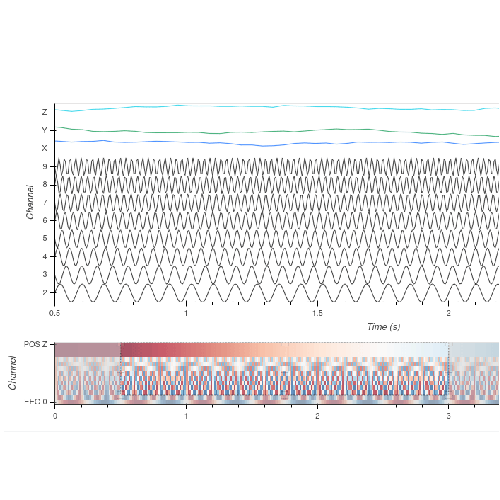
Multichannel Timeseries Viewer
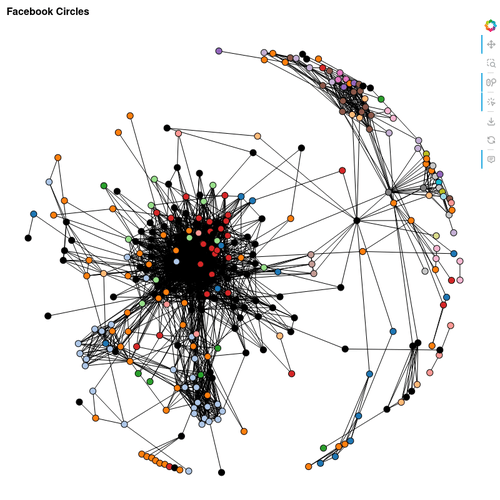
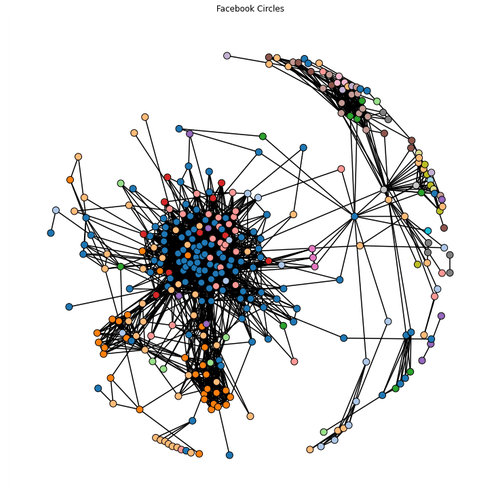
Network Graph
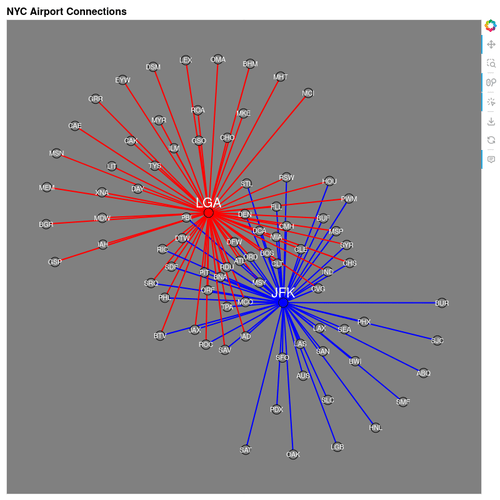
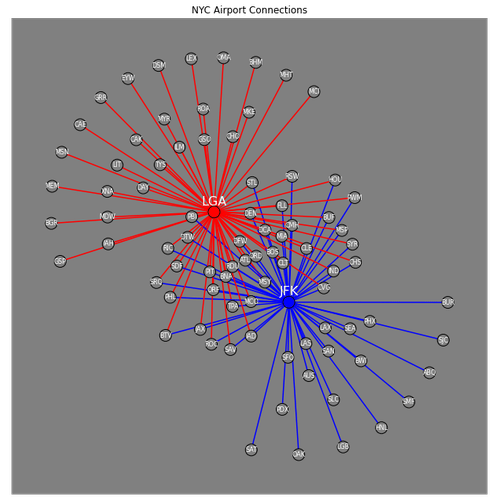
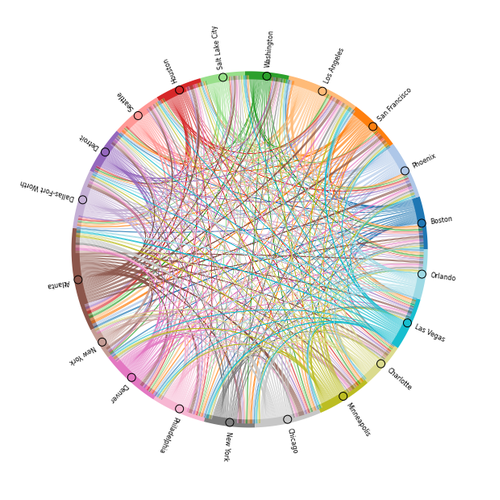
Nyc Airport Connections
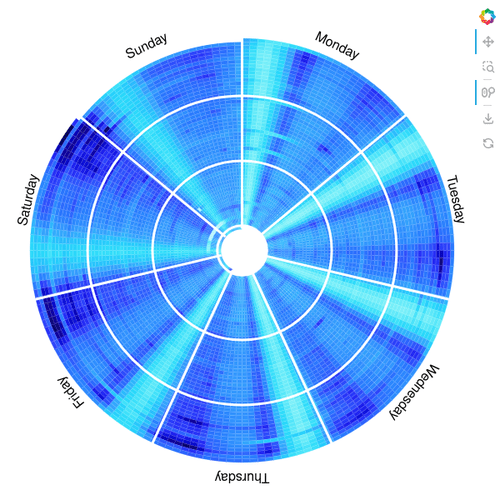
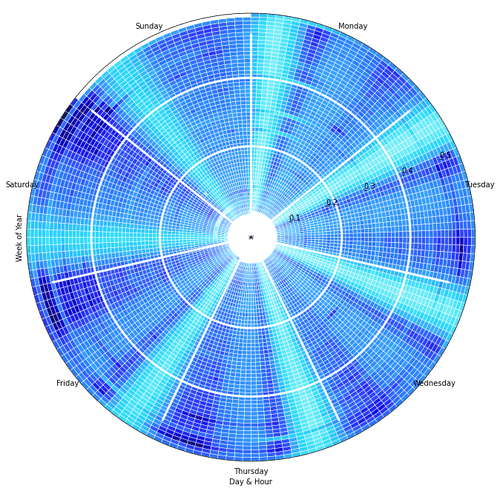
Nyc Radial Heatmap
Point Draw Triangulate
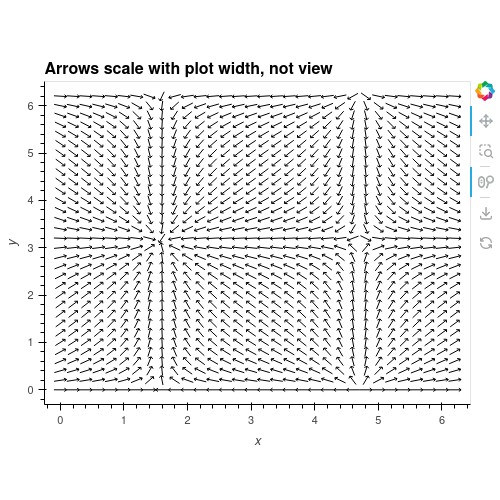
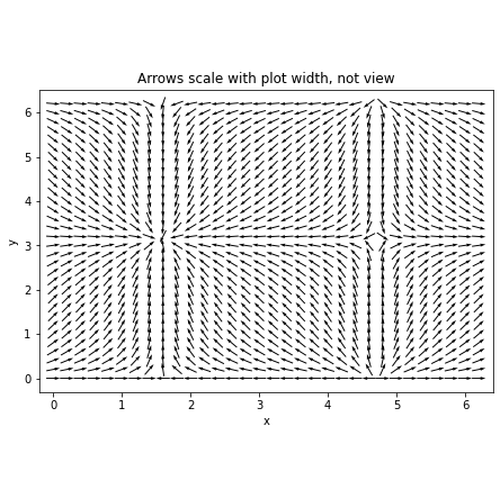
Quiver Demo
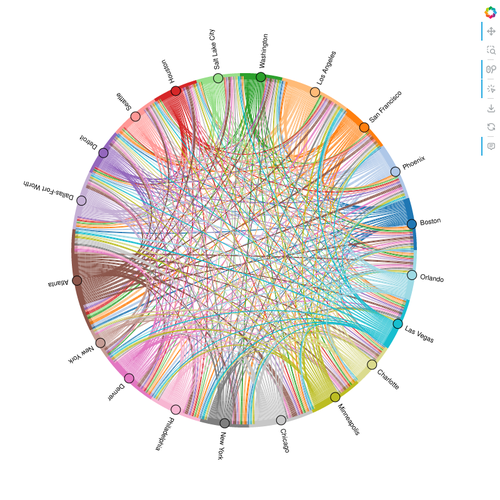
Route Chord
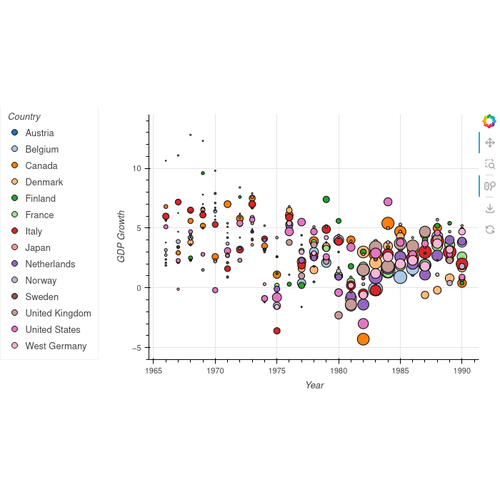
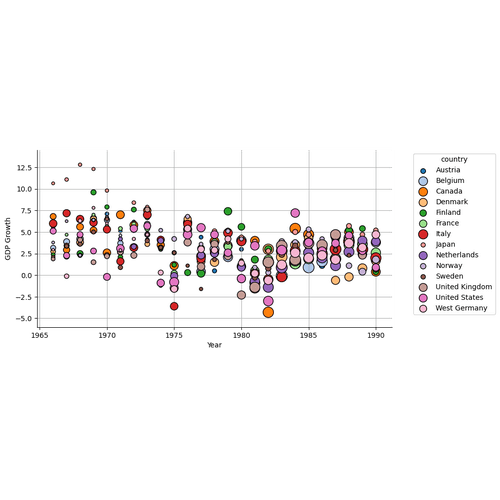
Scatter Economic
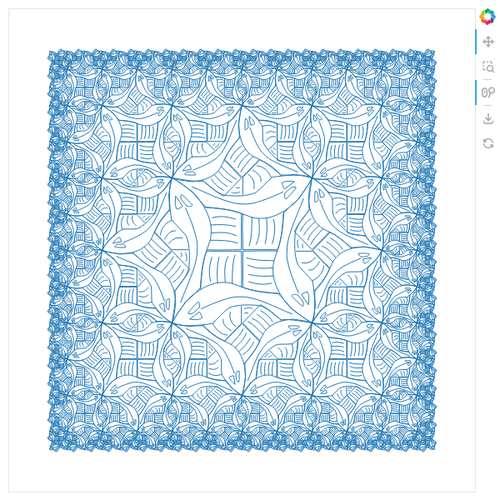
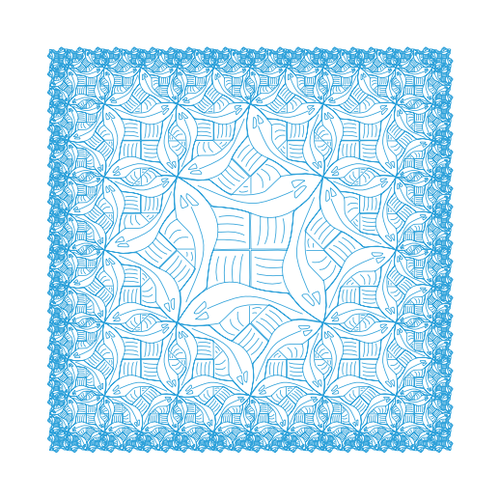
Square Limit
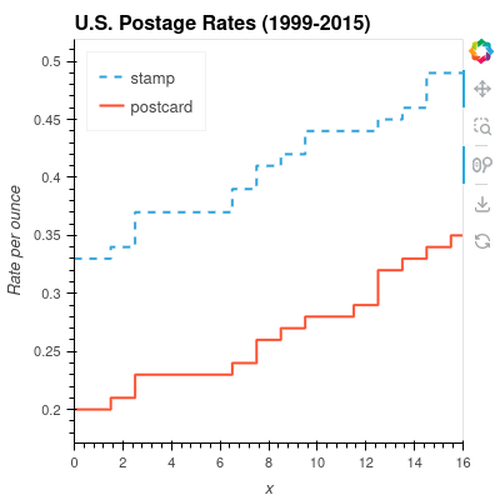
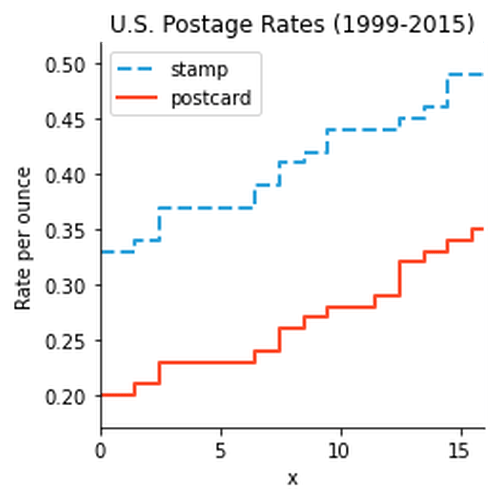
Step Chart
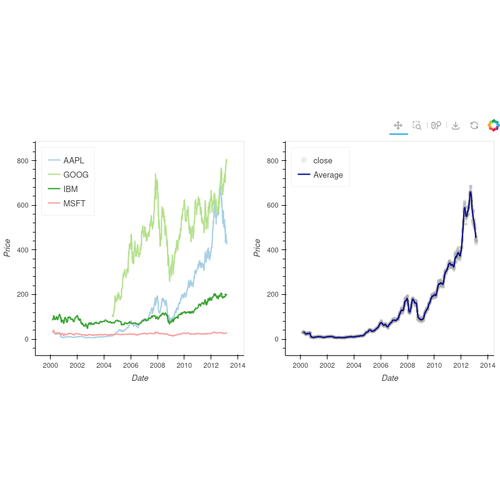
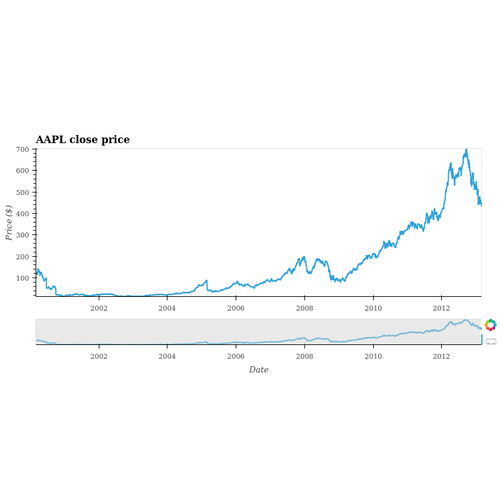
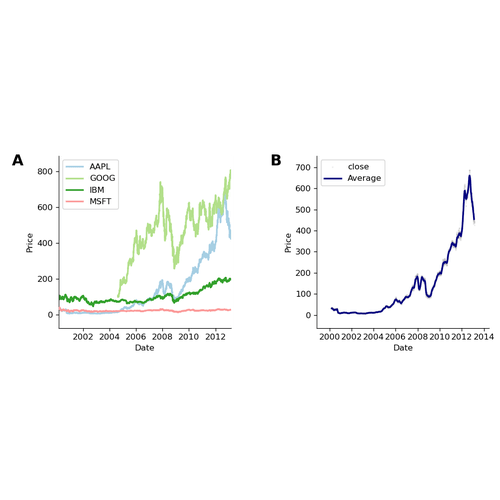
Stocks Example
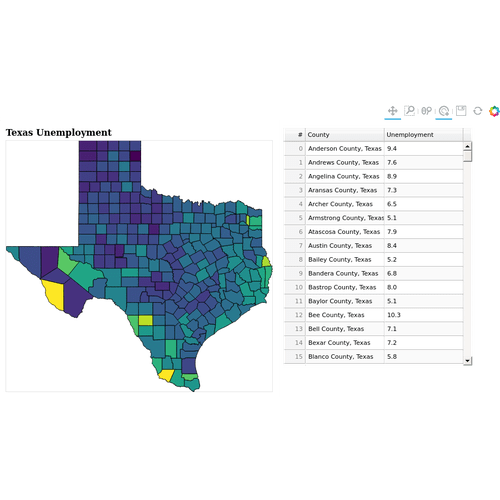
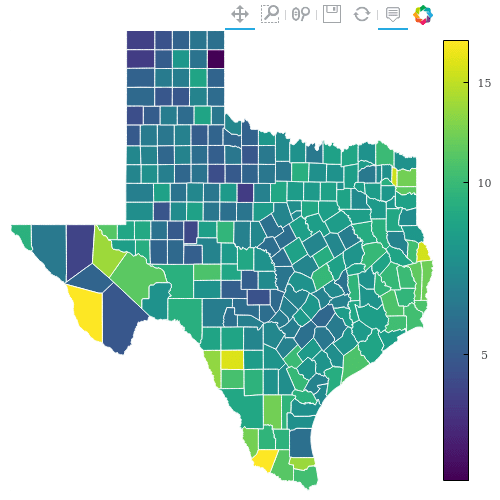
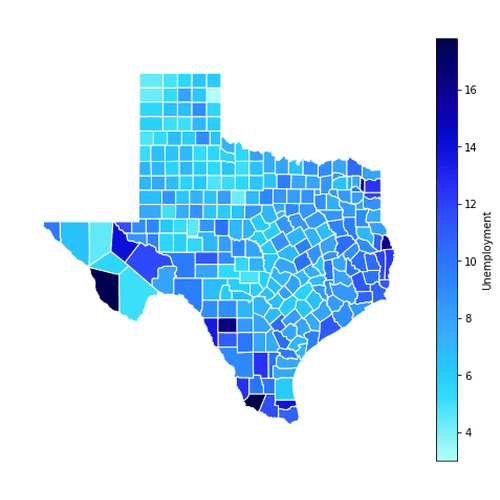
Texas Choropleth Example
Timeseries Range Tool
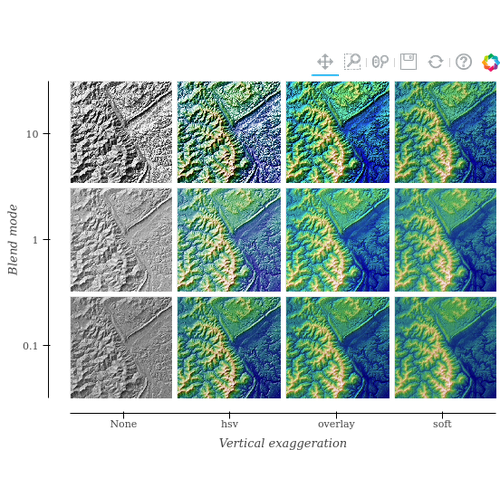
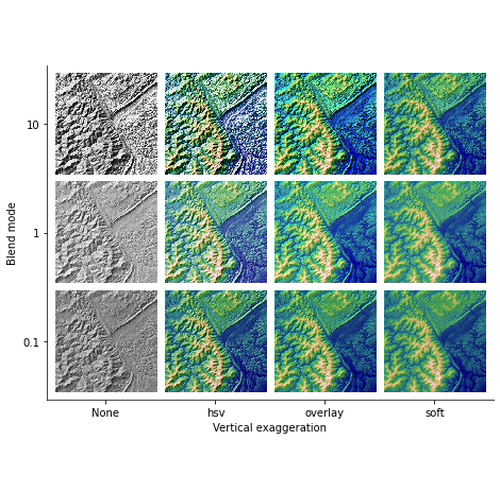
Topographic Hillshading
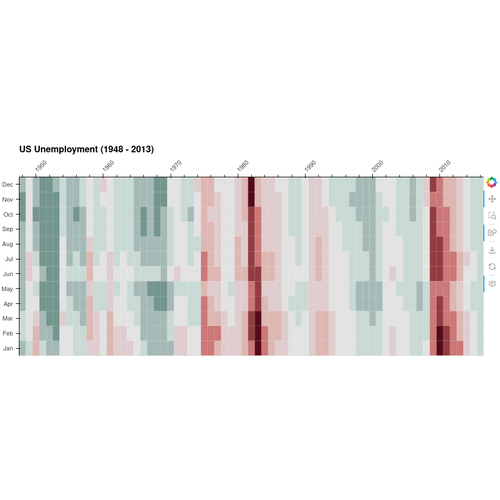
Us Unemployment
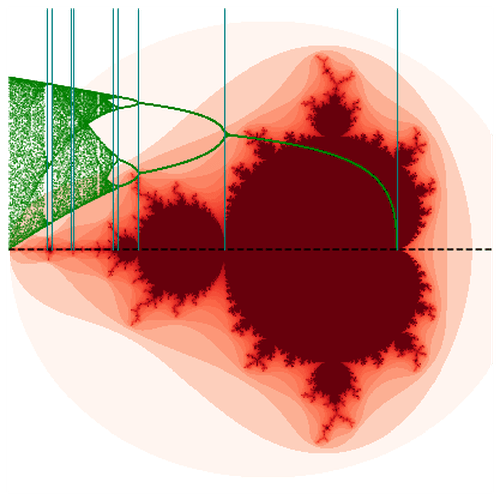
Verhulst Mandelbrot
Area Chart
Autompg Histogram
Autompg Violins

Bachelors Degrees By Gender
Bars Economic
Boxplot Chart
Directed Airline Routes
Dragon Curve

Dropdown Economic
Energy Sankey
Hextile Movie Ratings
Histogram Example
Iris Density Grid
Iris Example
Iris Grouped Grid
Iris Splom Example
Irregular Quadmesh
Legend Example
Lorenz Attractor Example
Mandelbrot Section
Measles Example
Network Graph
Nyc Airport Connections
Nyc Radial Heatmap
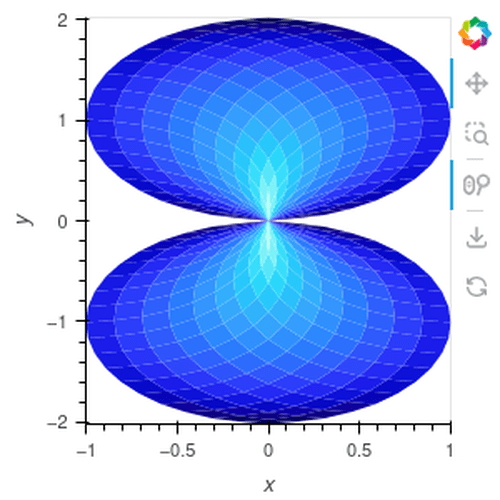
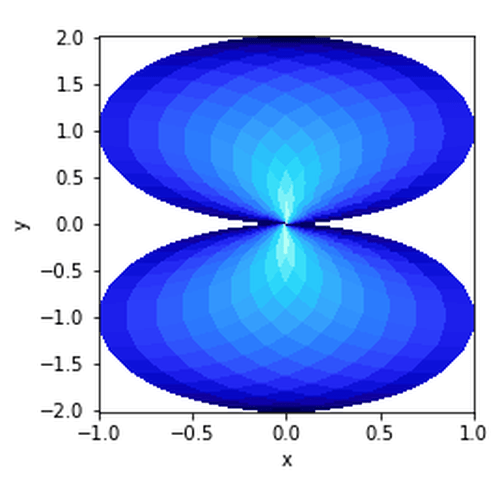
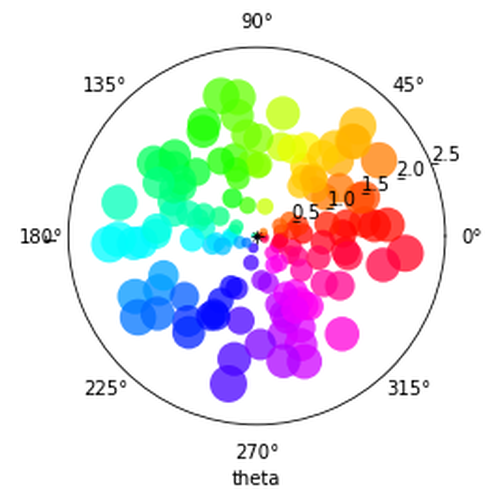
Polar Scatter Demo
Quiver Demo
Route Chord
Scatter Economic
Square Limit
Step Chart
Stocks Example
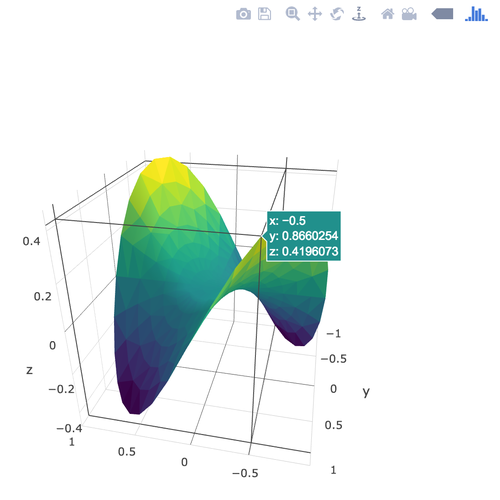
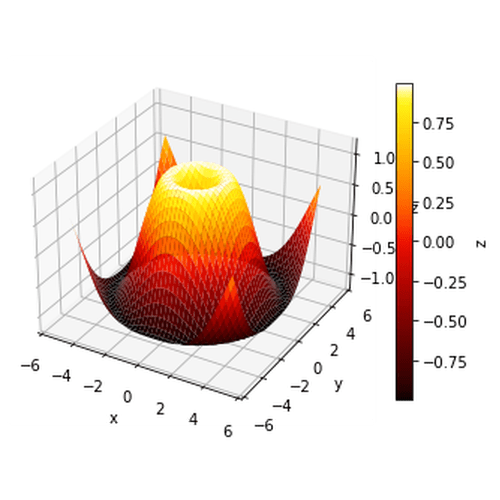
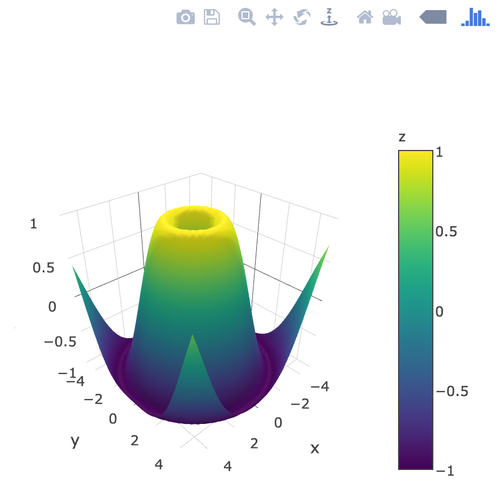
Surface 3d
Texas Choropleth Example
Topographic Hillshading
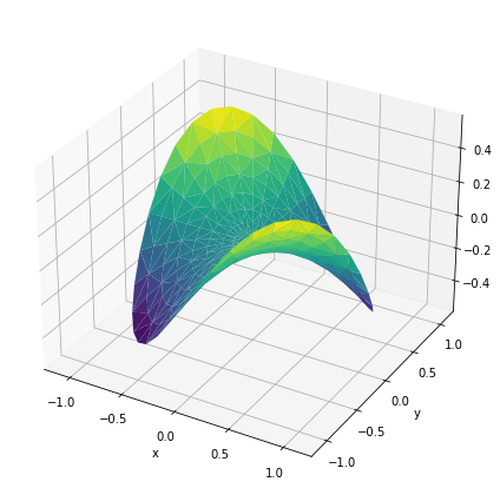
Trisurf3d Demo
Us Unemployment

Verhulst Mandelbrot
Surface 3d
Trisurf3d Demo