Reference Gallery#
Elements#
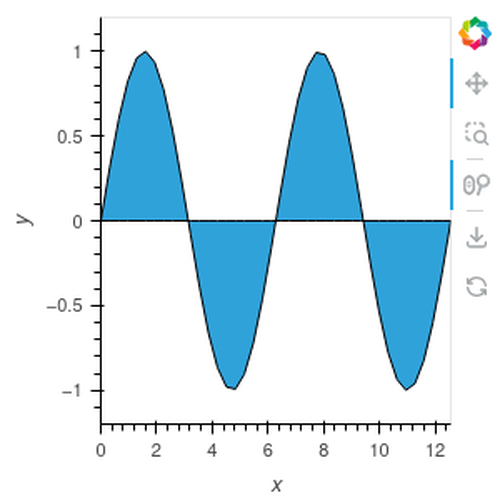
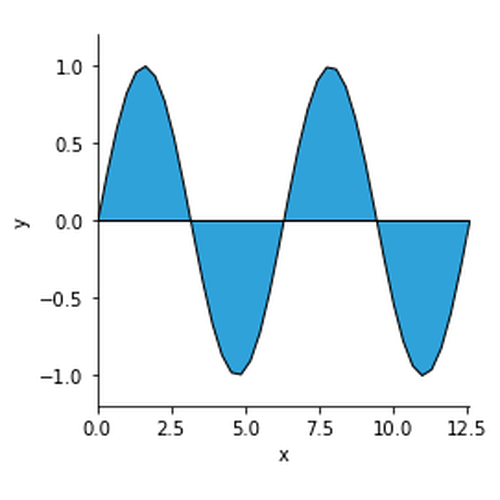
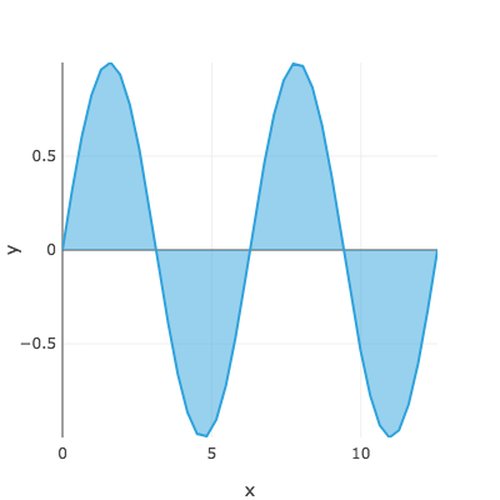
Area
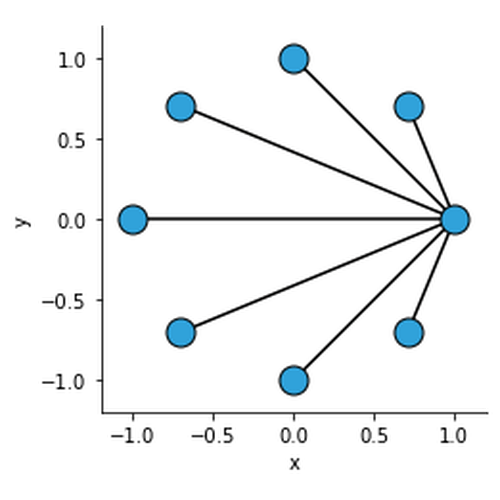
Arrow
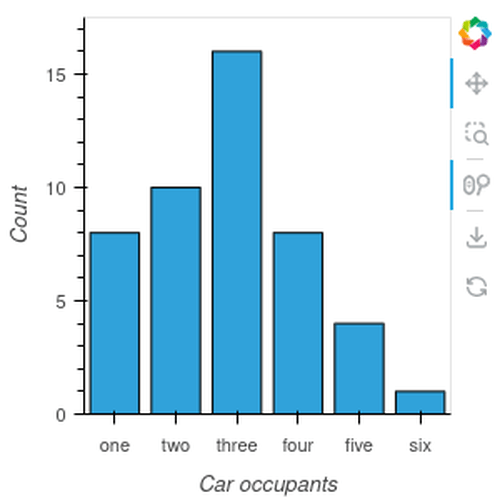
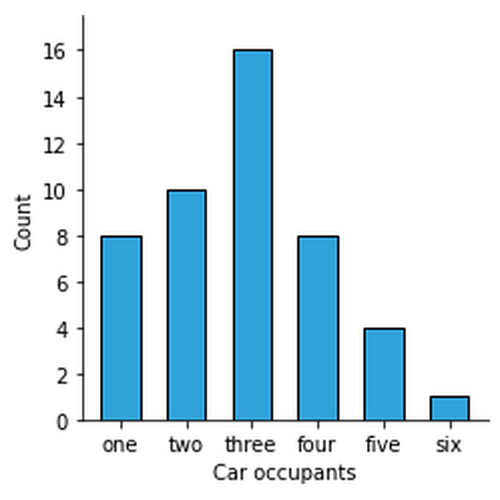
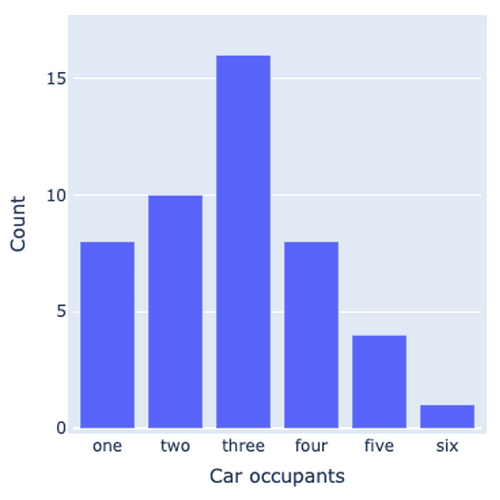
Bars
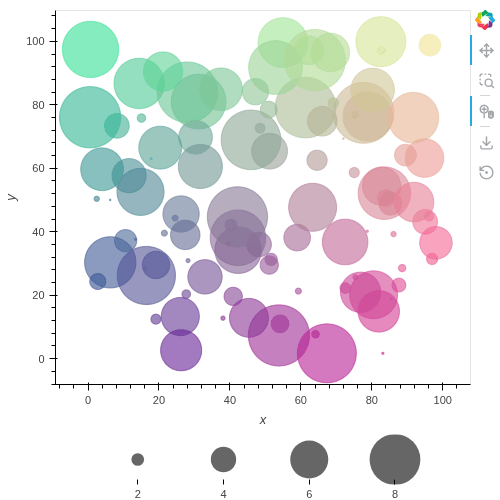
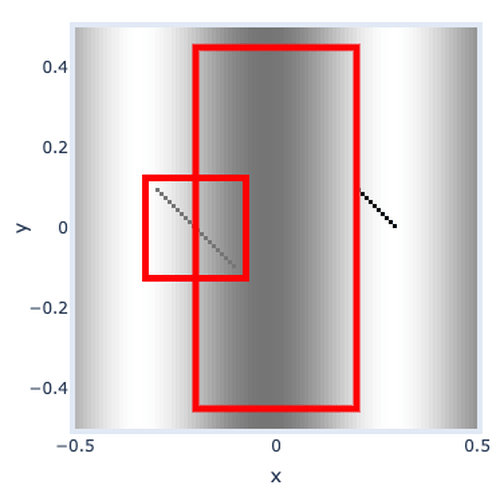
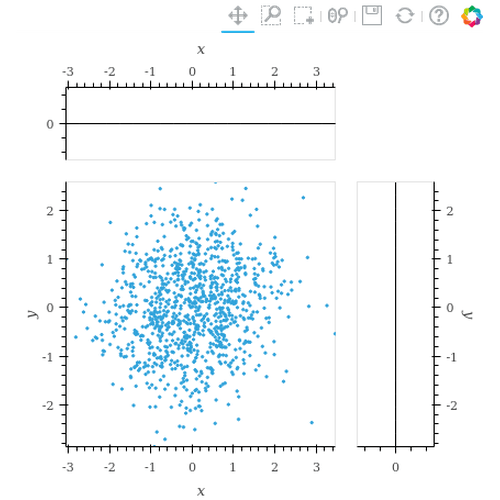
Bivariate
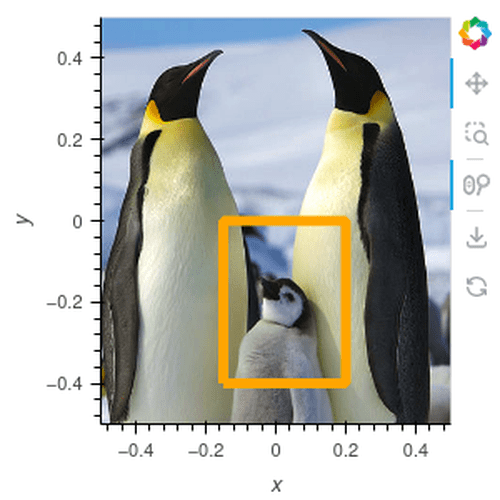
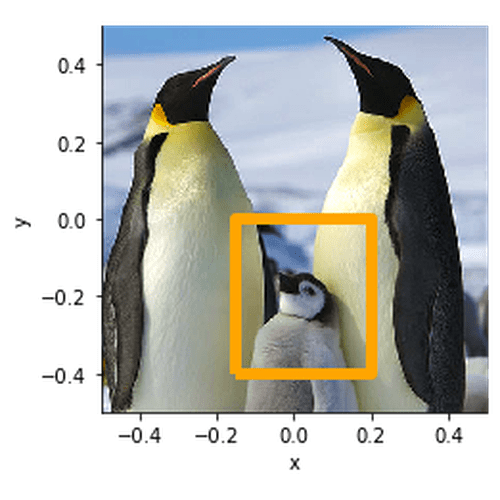
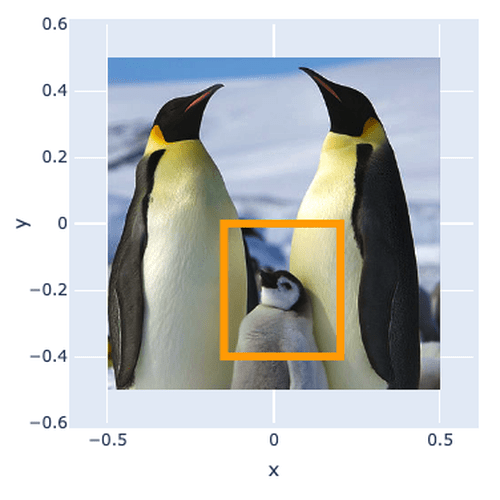
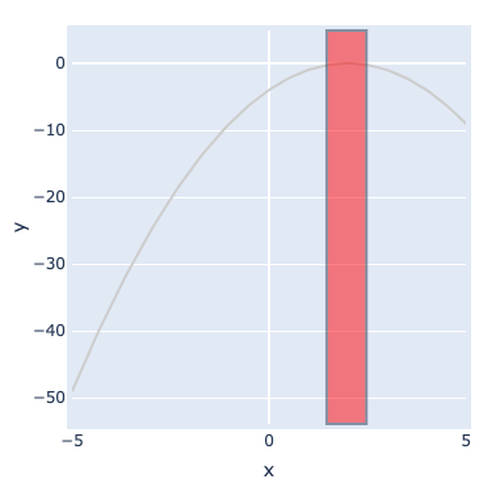
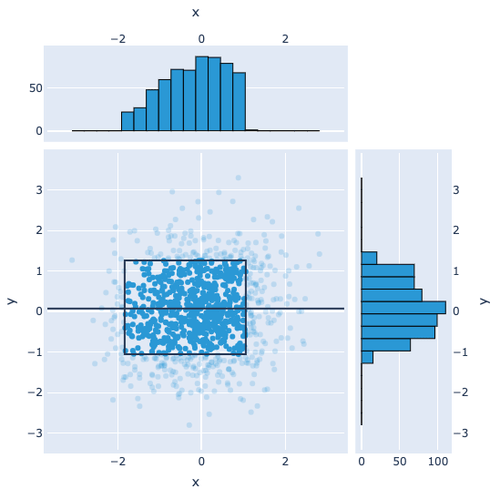
Bounds
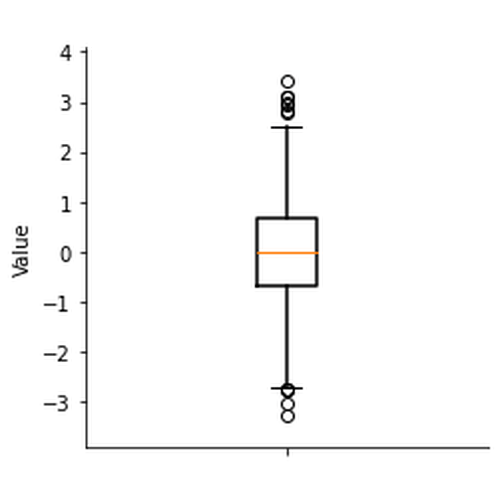
Box
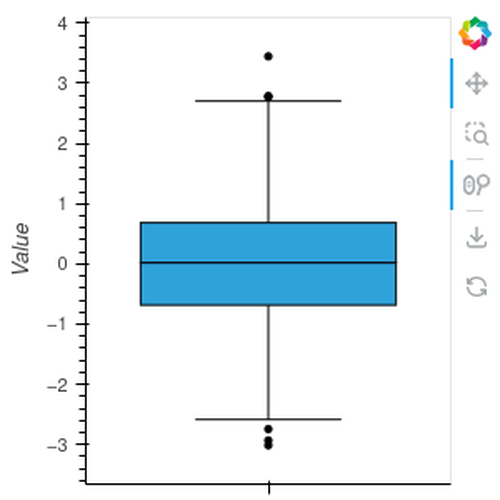
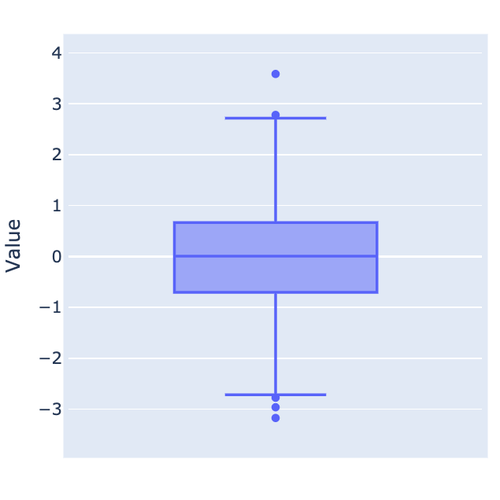
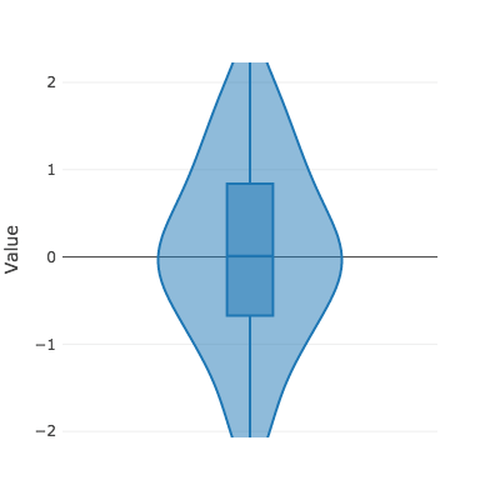
BoxWhisker
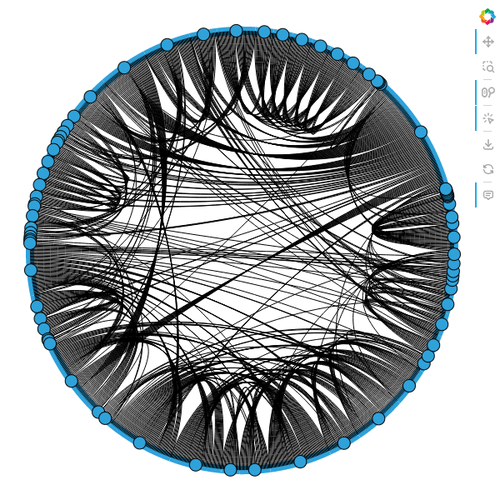
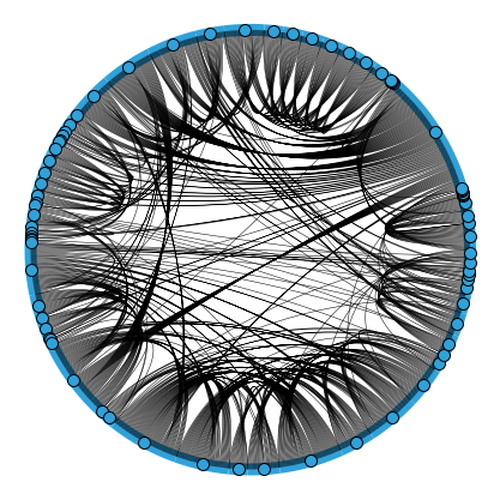
Chord
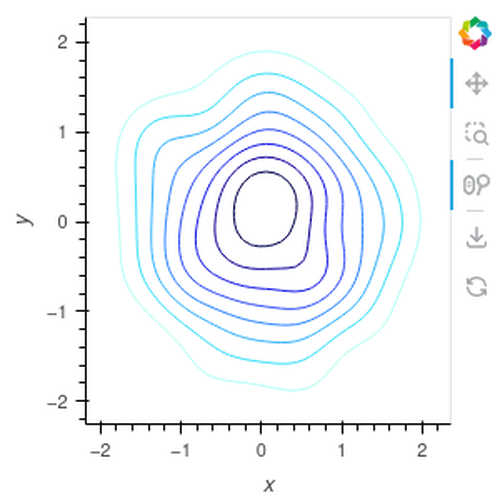
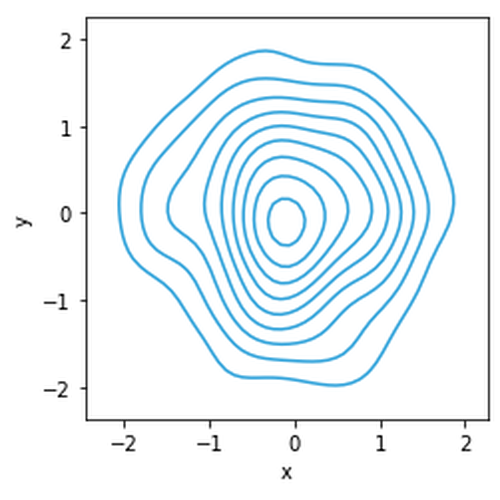
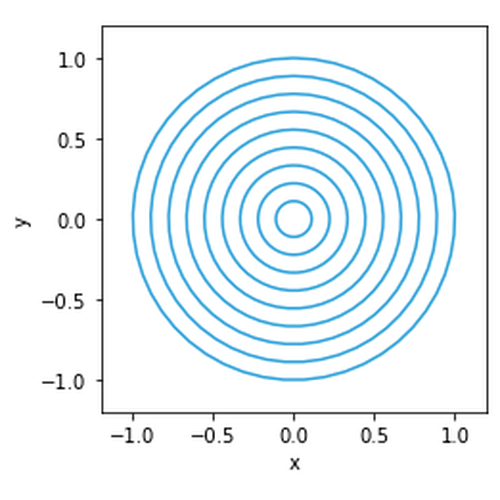
Contours
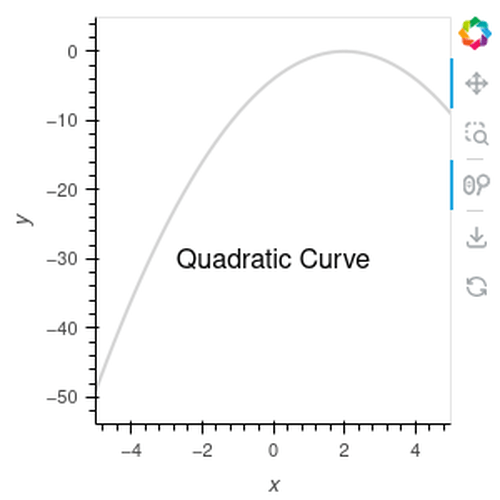
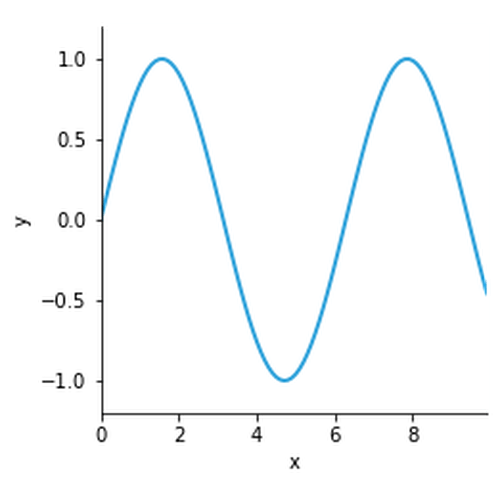
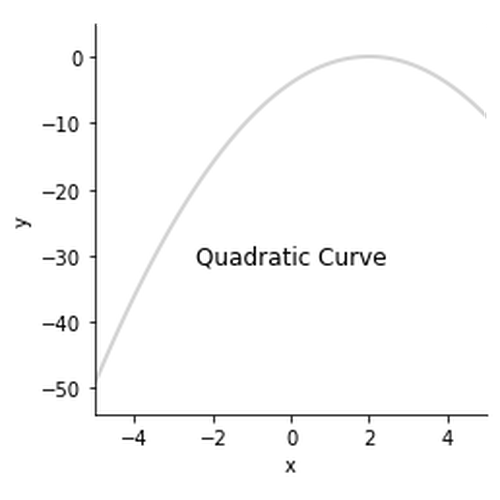
Curve
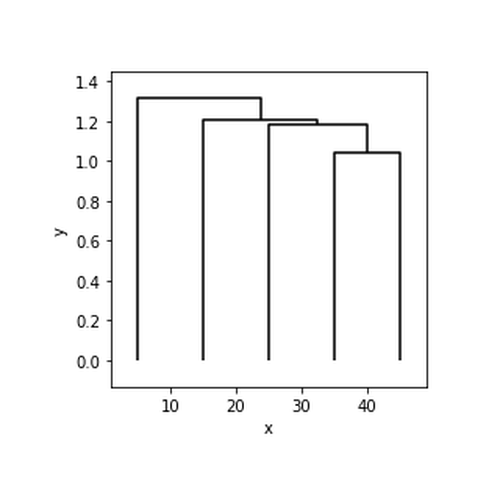
Dendrogram
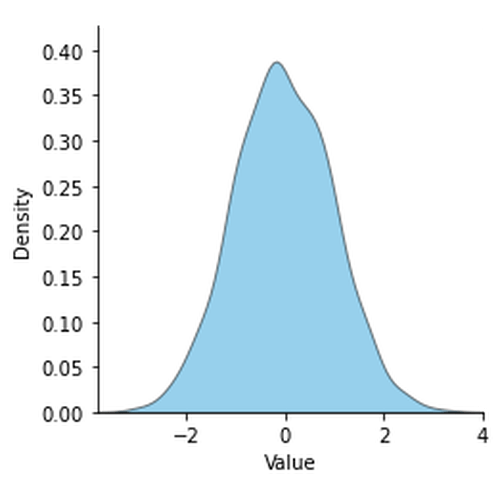
Distribution
Div
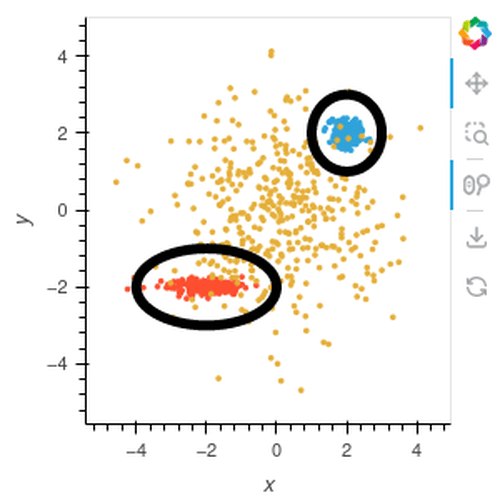
Ellipse
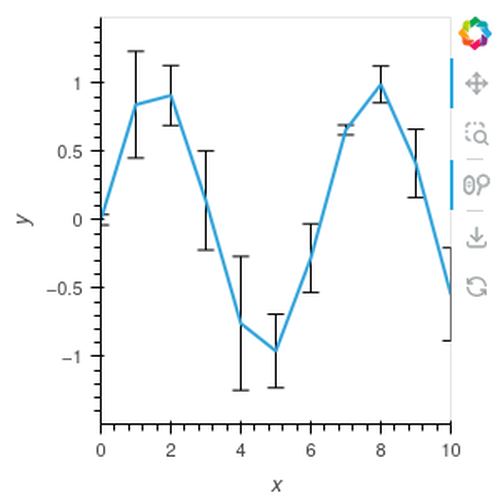
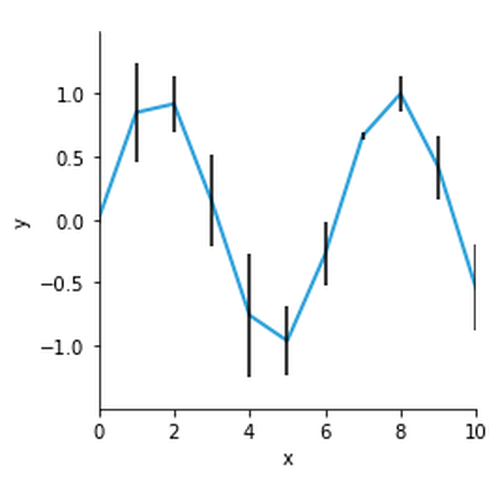
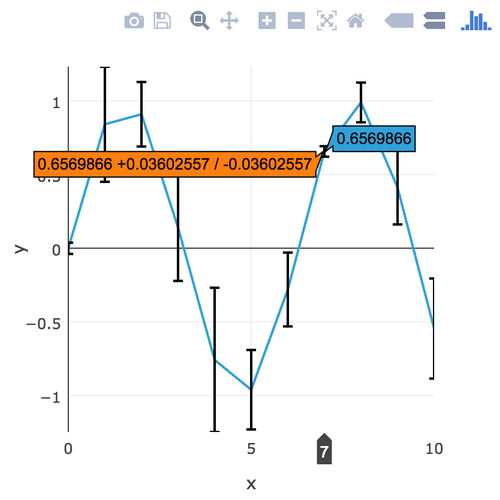
ErrorBars
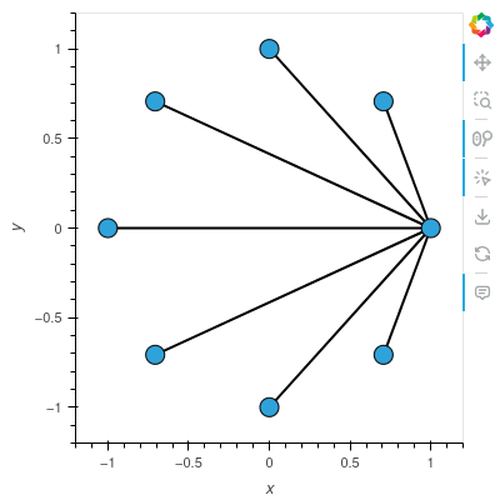
Graph
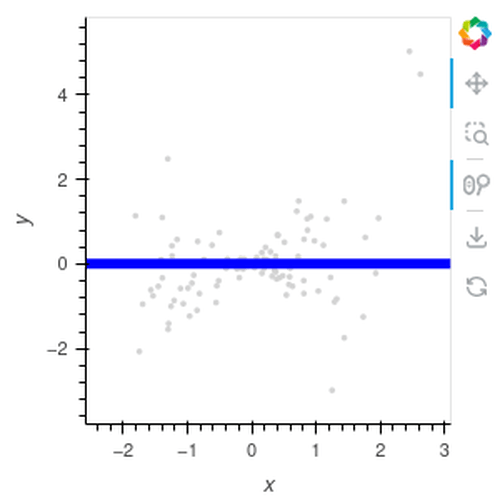
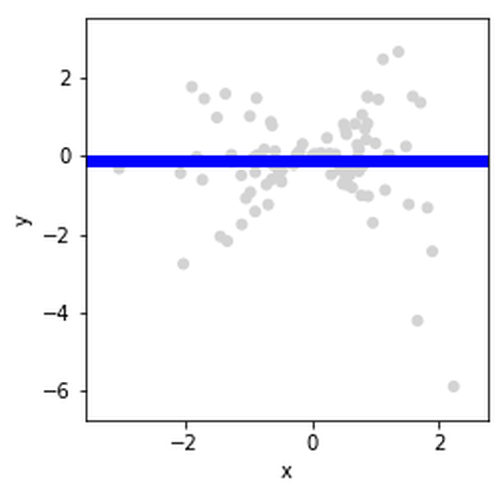
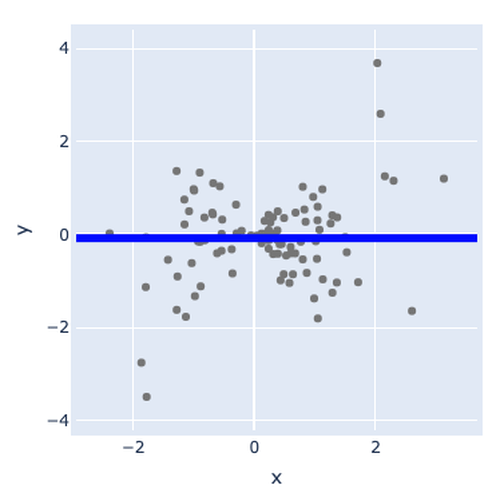
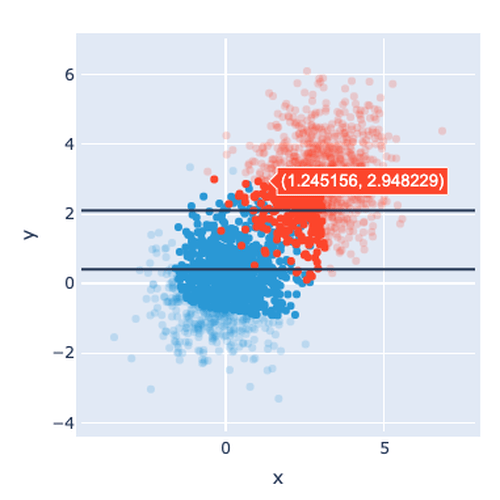
HLine
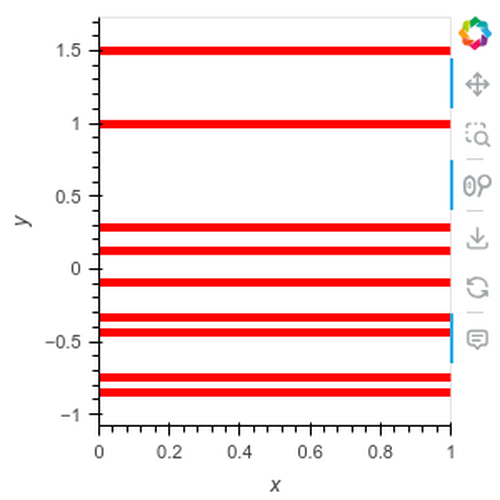
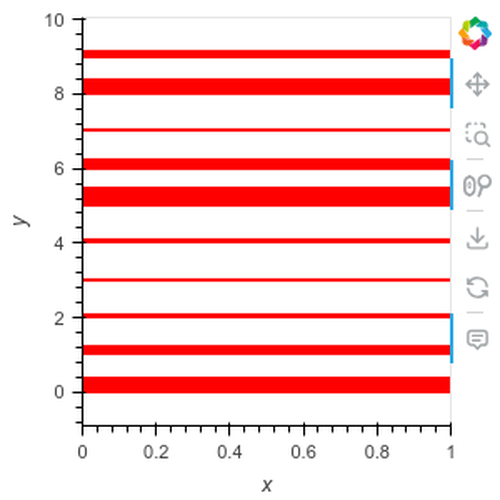
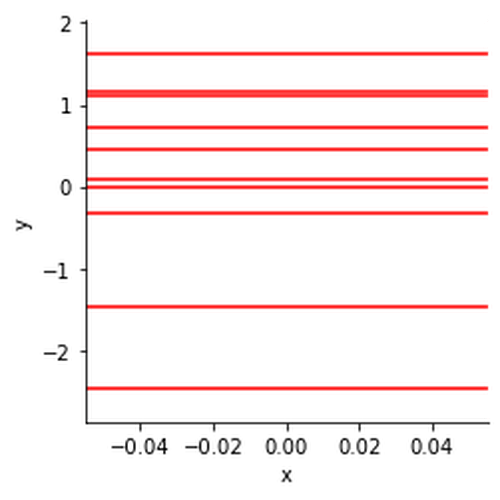
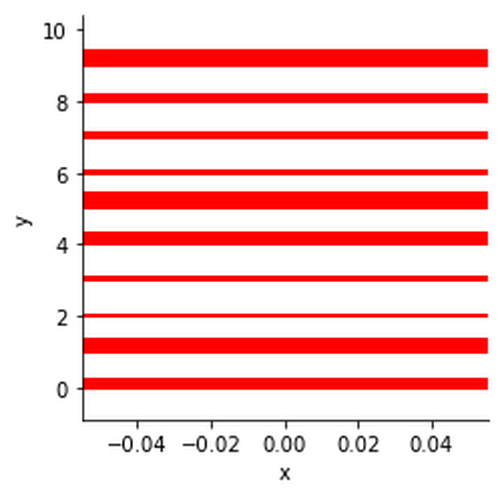
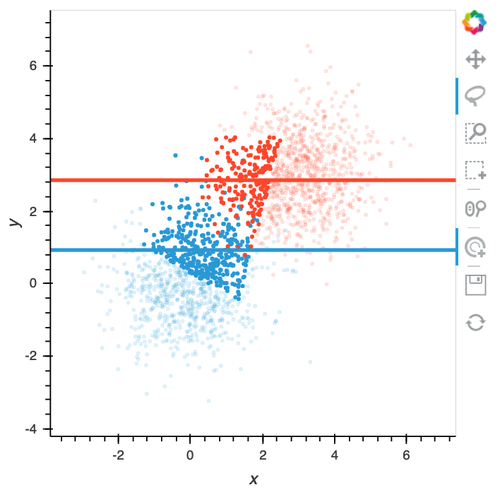
HLines
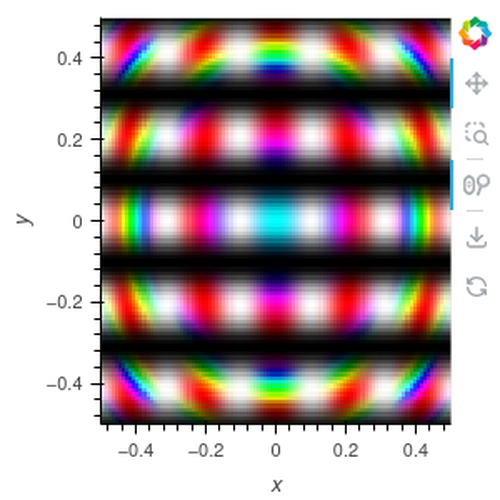
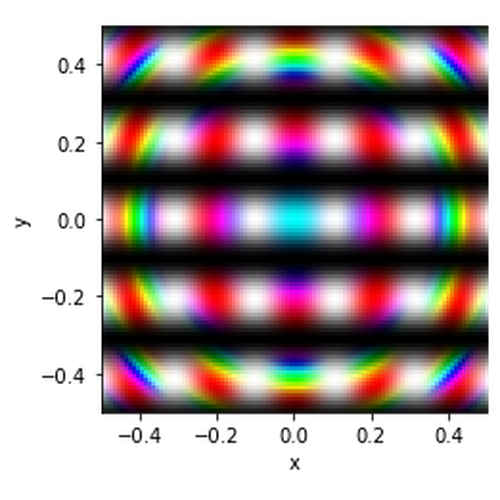
HSV
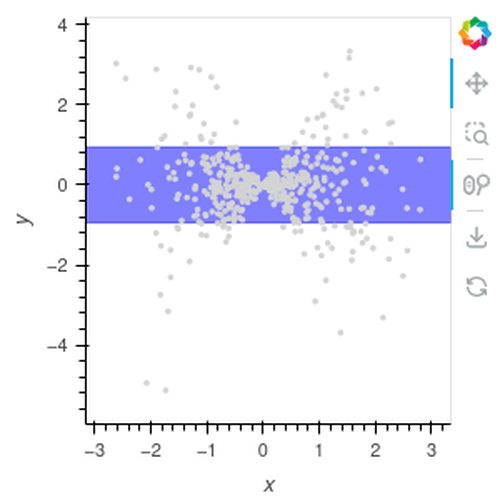
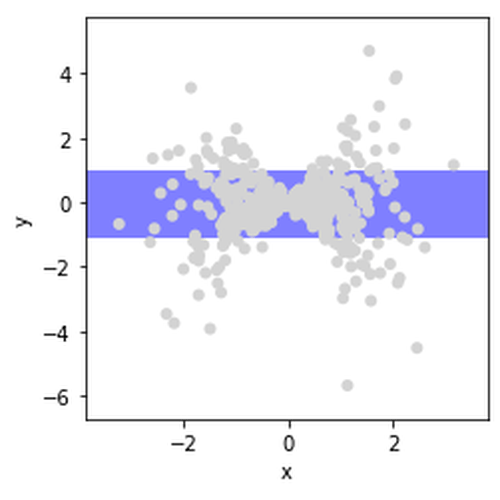
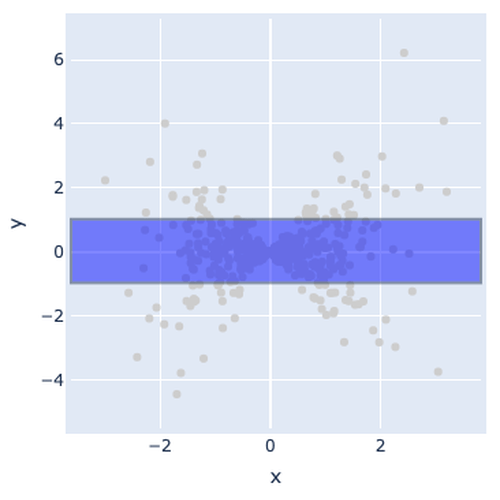
HSpan
HSpans
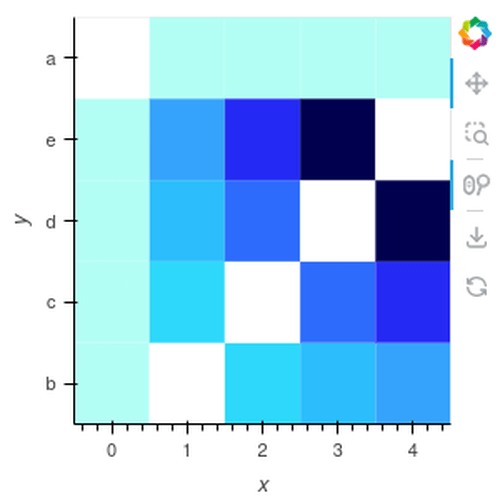
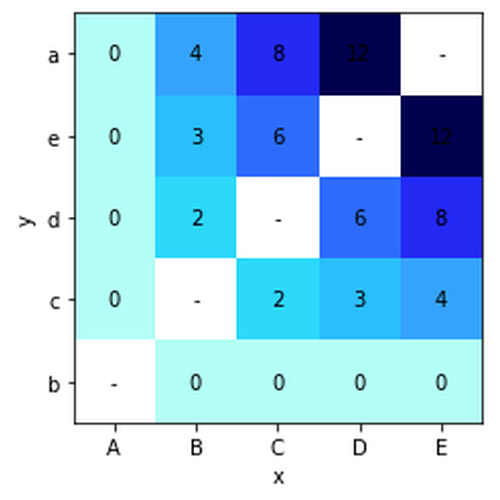
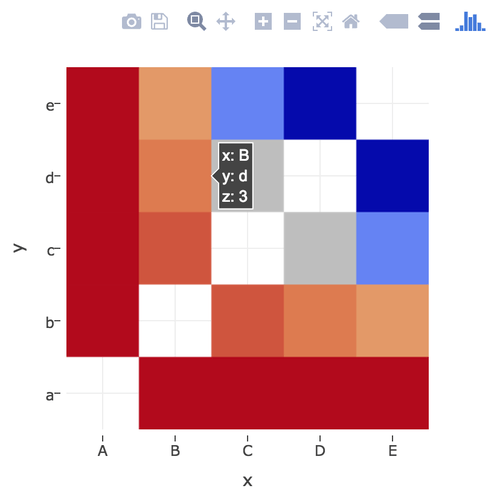
HeatMap
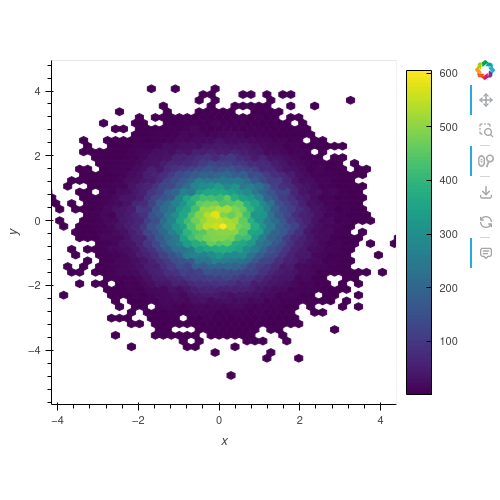
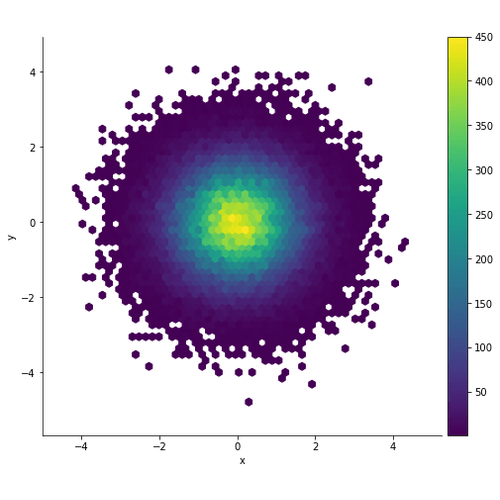
HexTiles
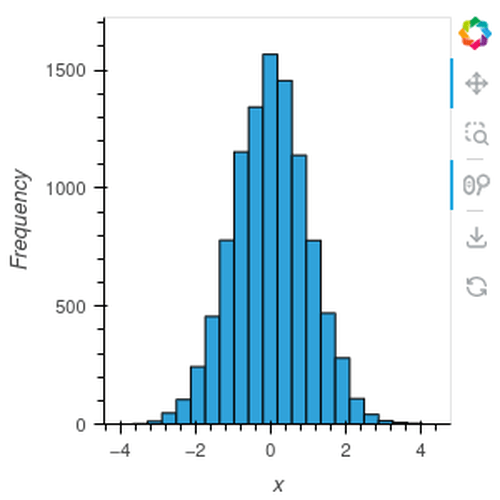
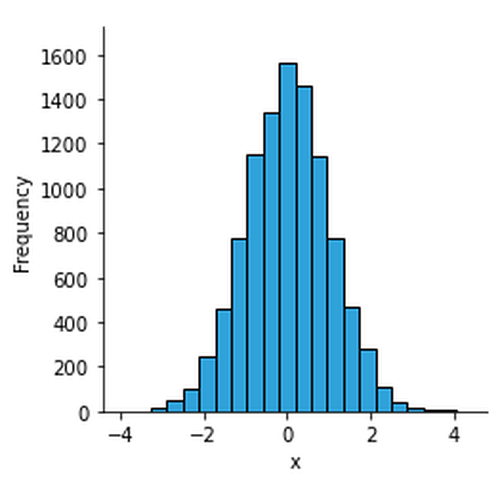
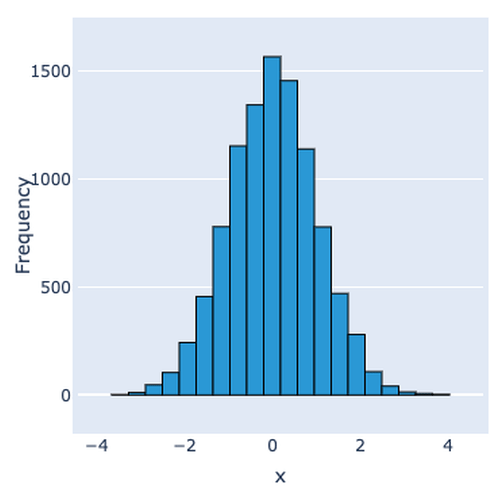
Histogram
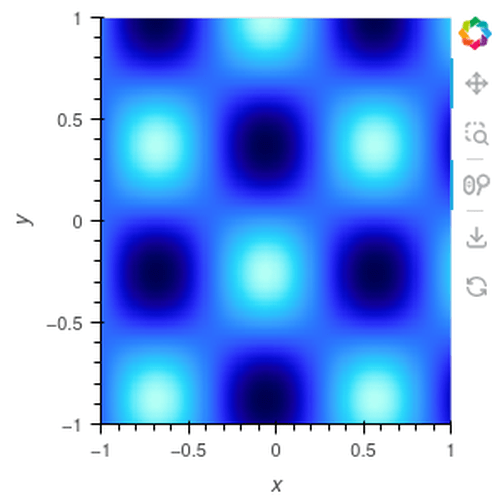
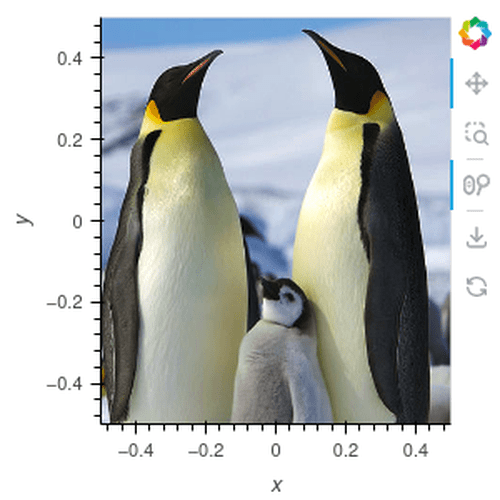
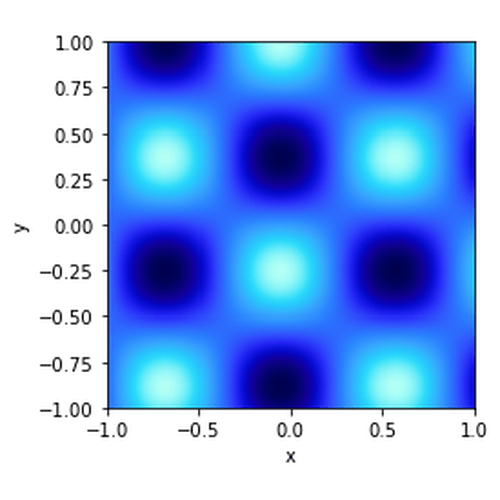
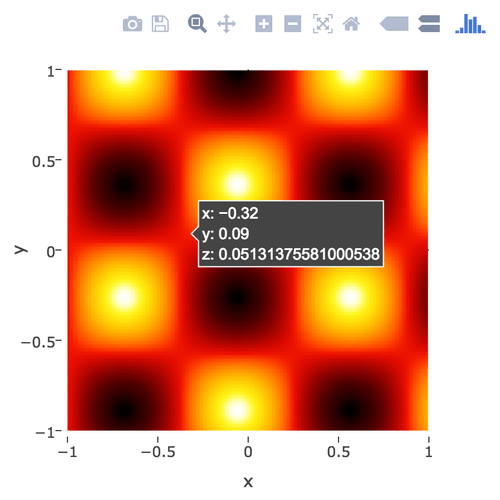
Image
ImageStack
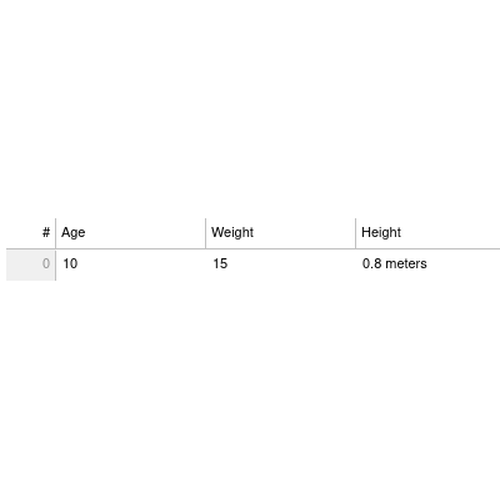
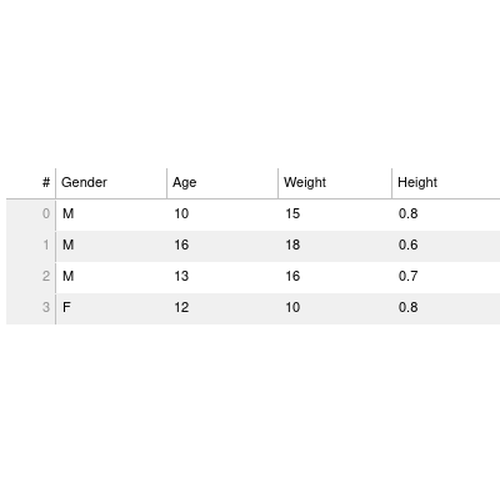
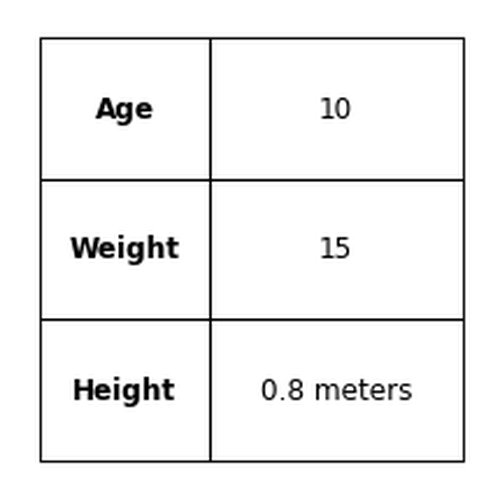
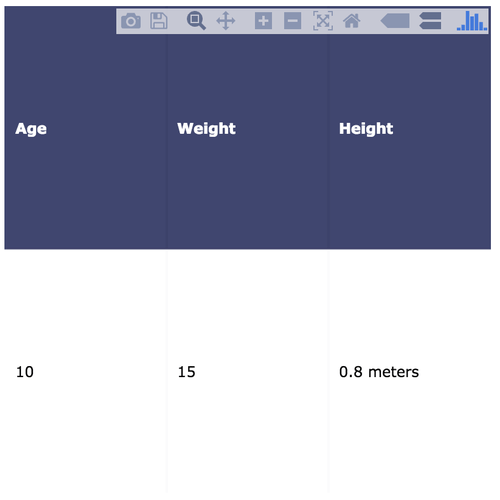
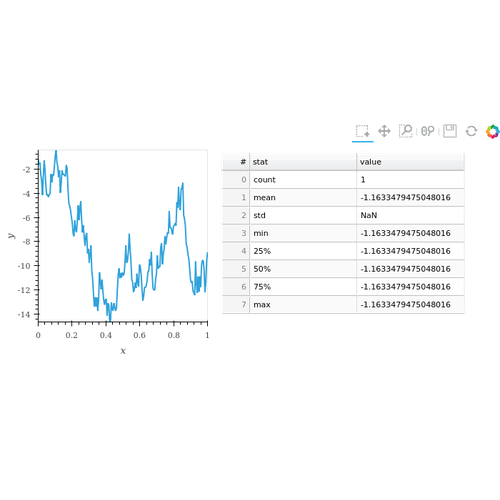
ItemTable
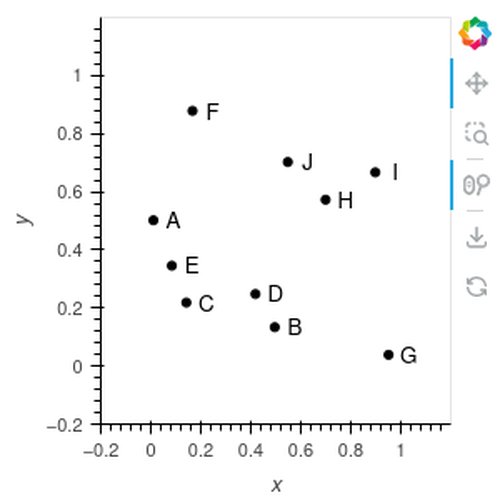
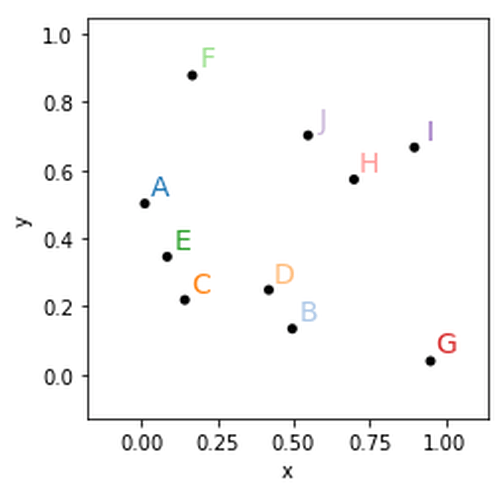
Labels
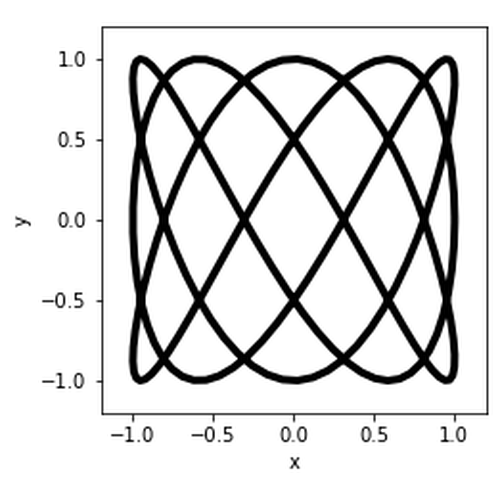
Path
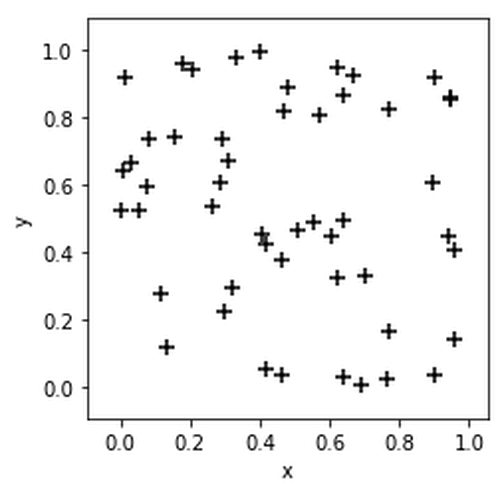
Points
Polygons
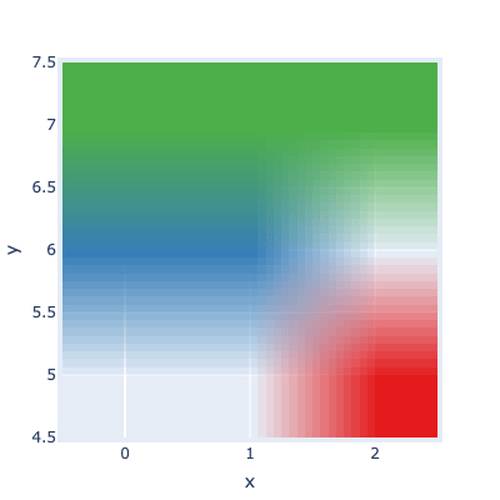
QuadMesh
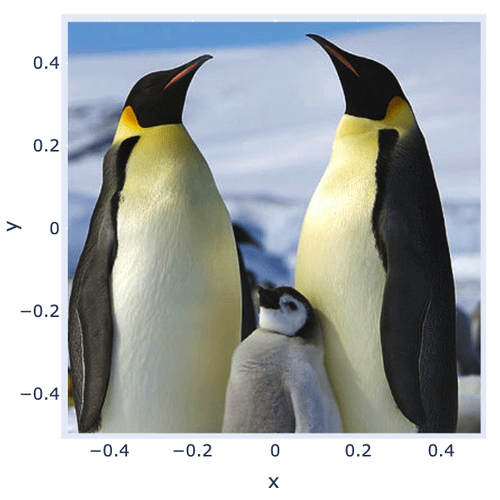
RGB
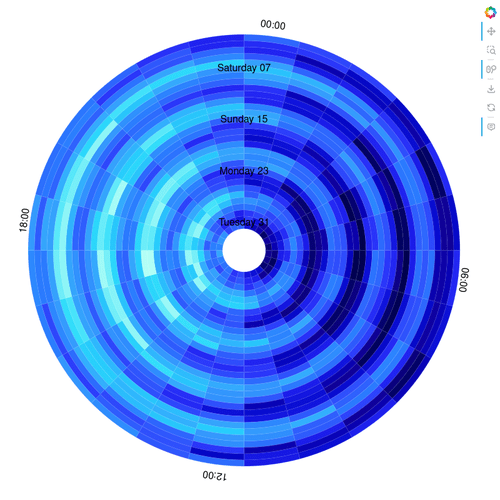
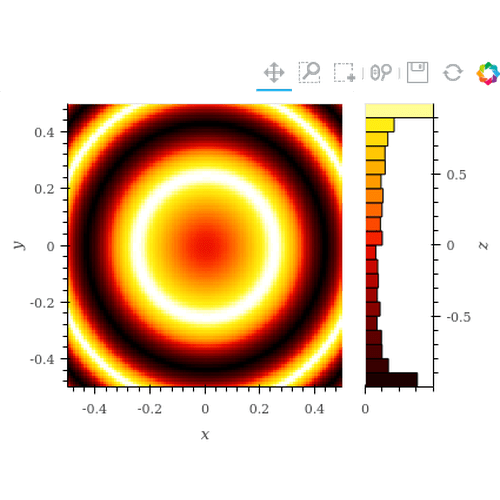
RadialHeatMap
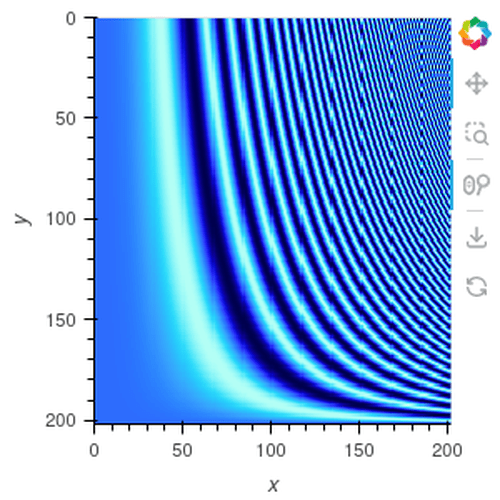
Raster
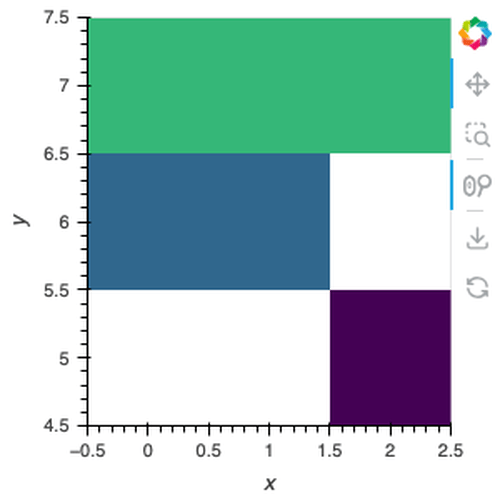
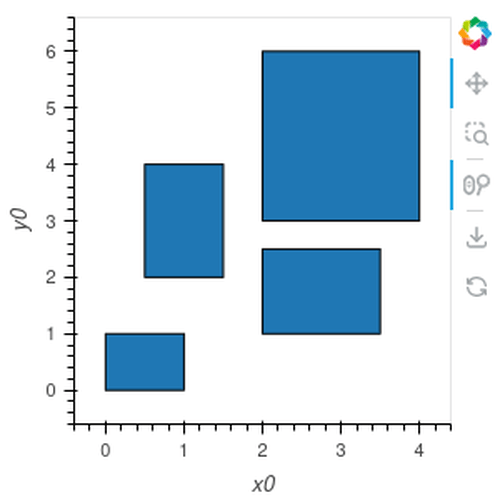
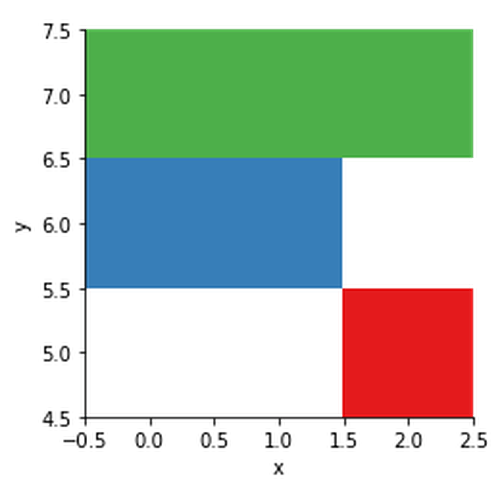
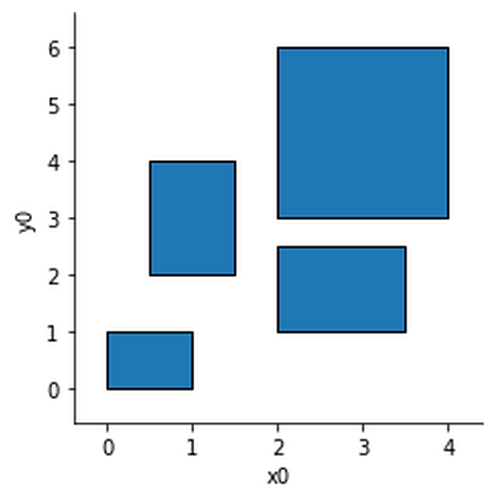
Rectangles
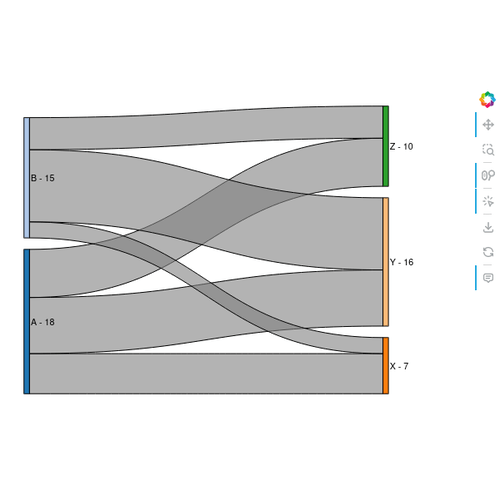
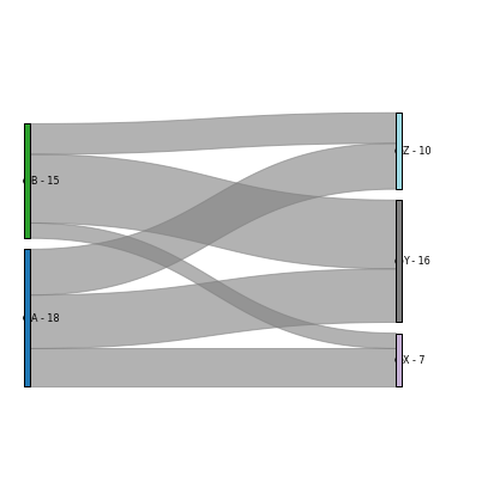
Sankey
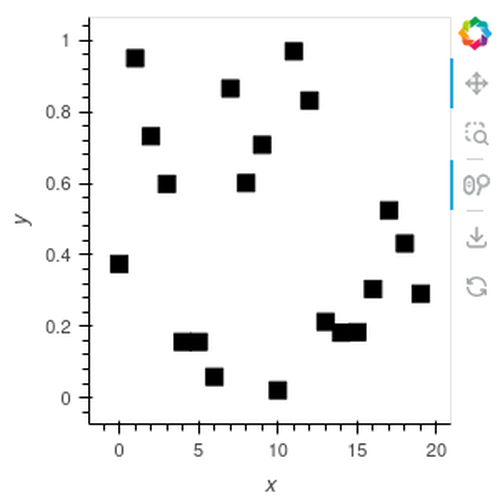
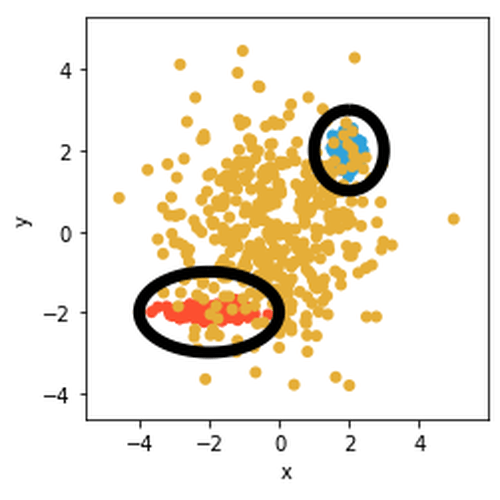
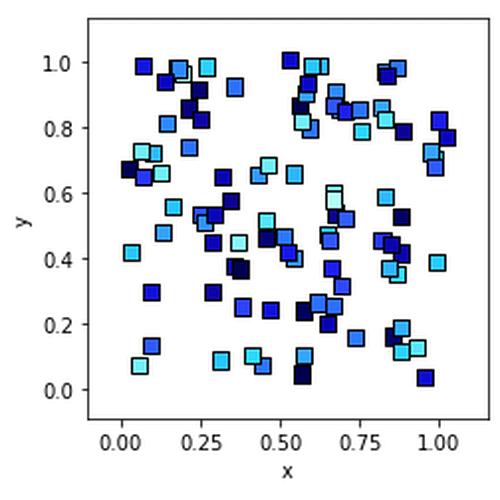
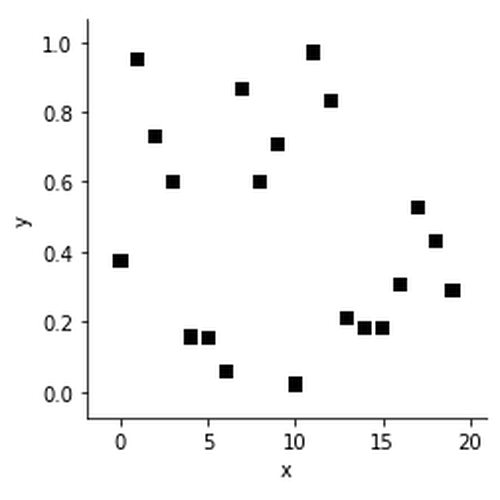
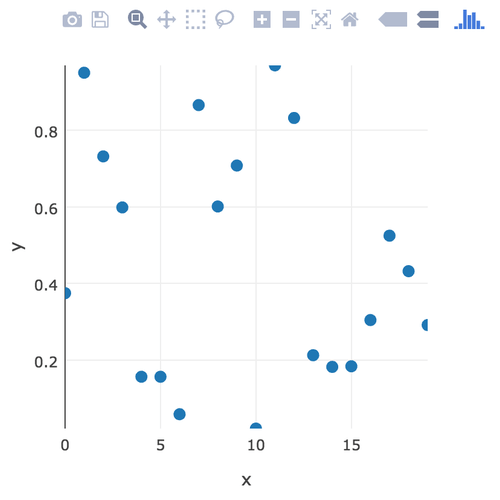
Scatter
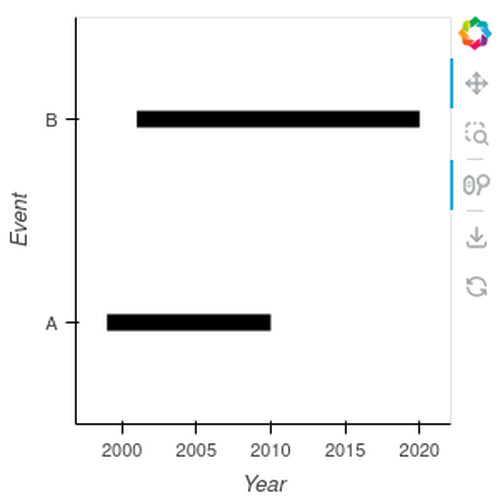
Segments
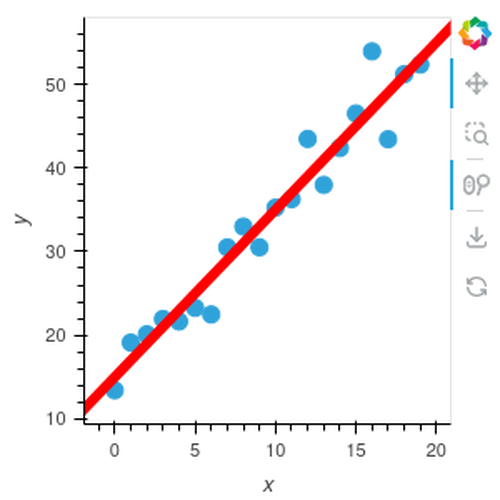
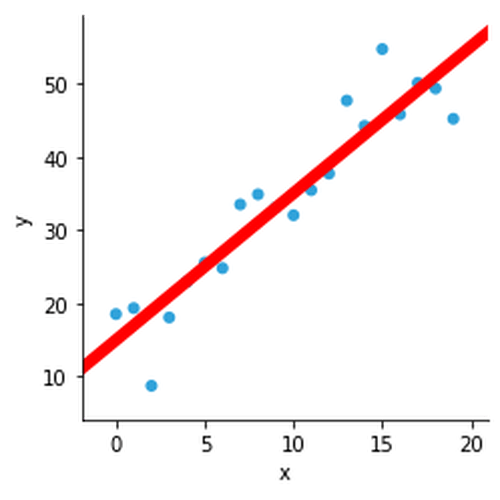
Slope
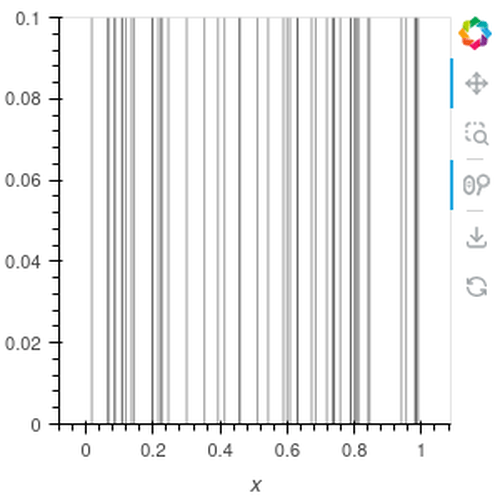
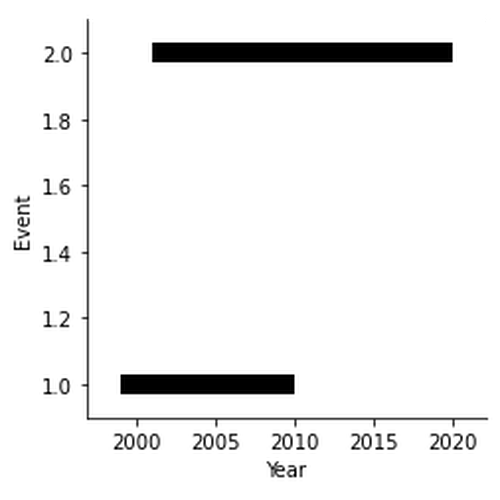
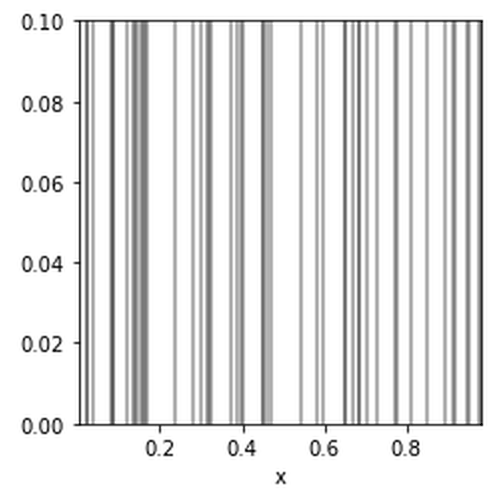
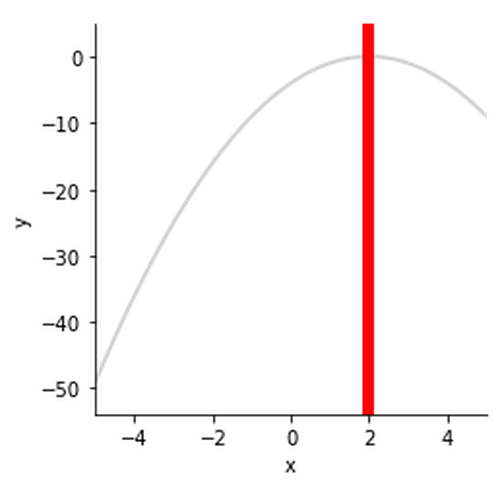
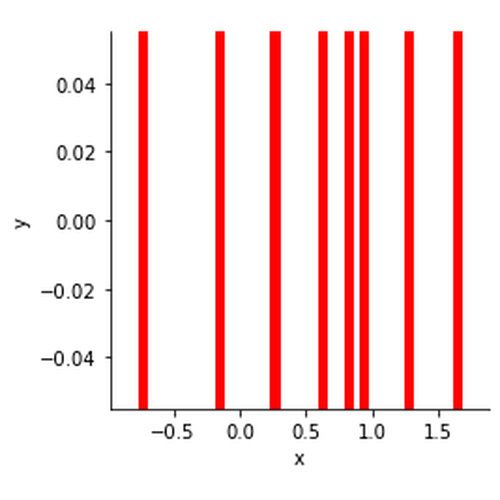
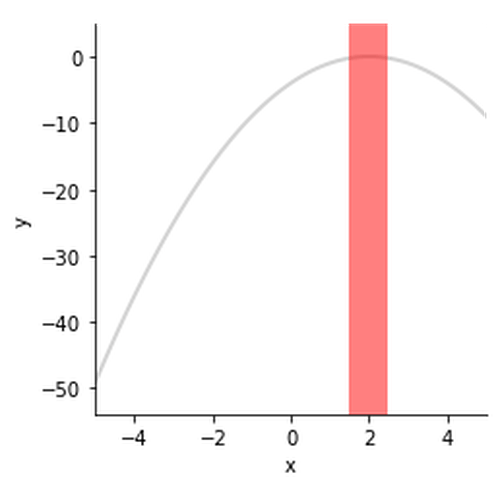
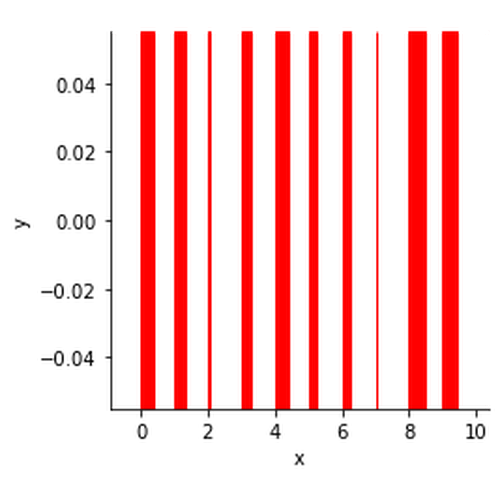
Spikes
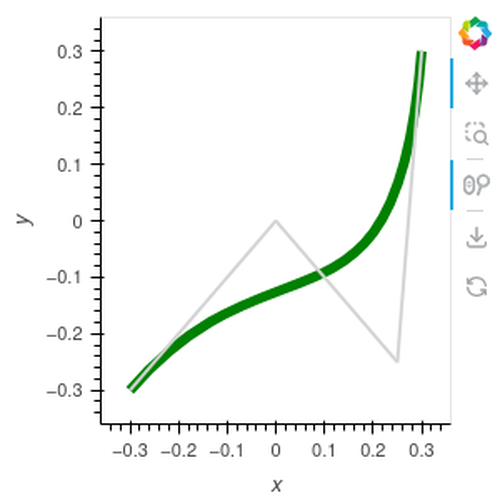
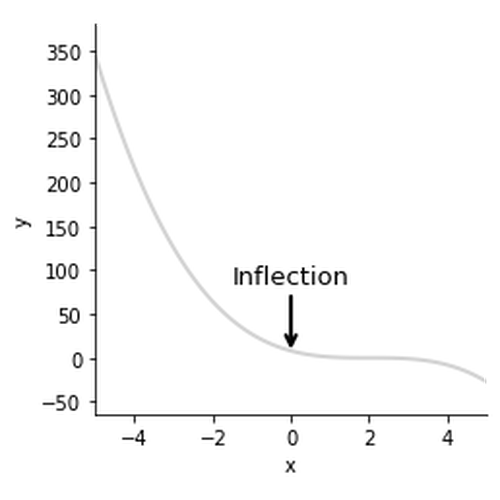
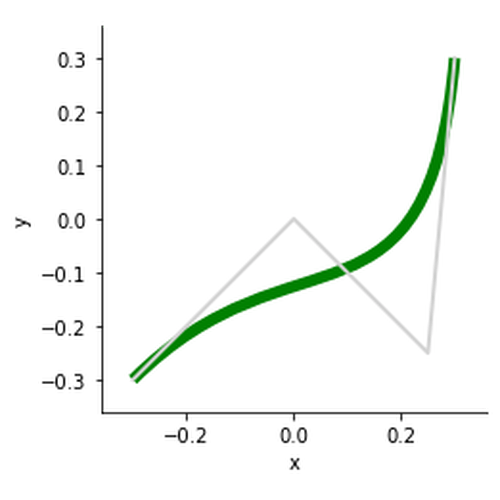
Spline
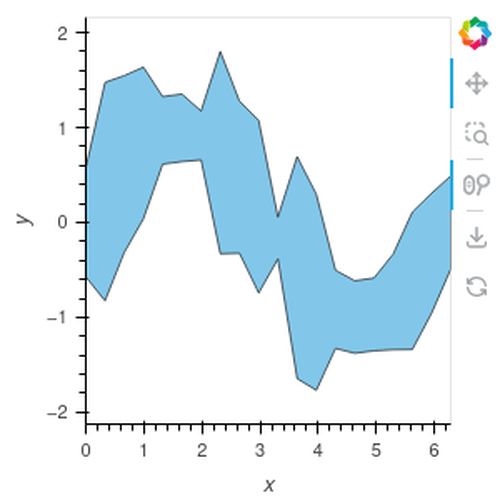
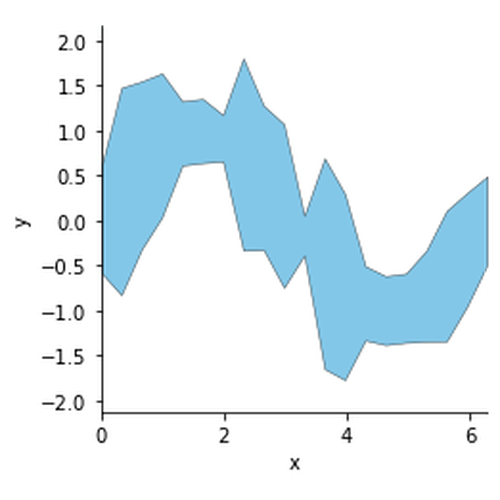
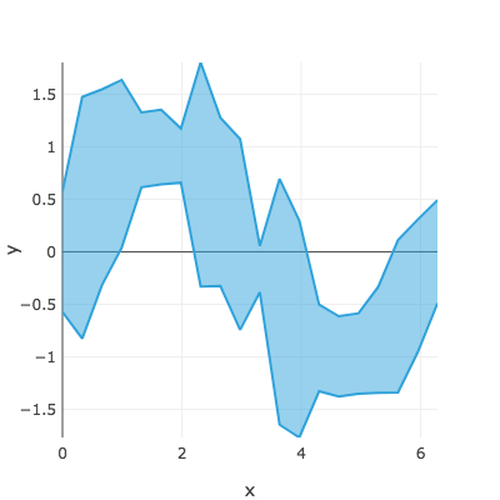
Spread
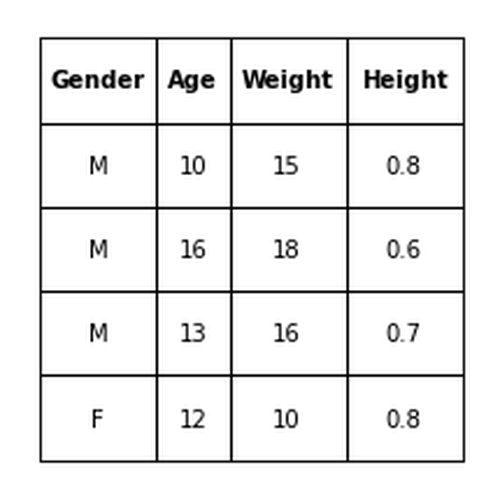
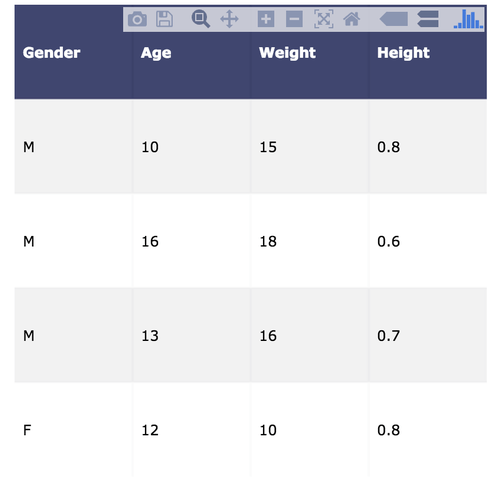
Table
Text
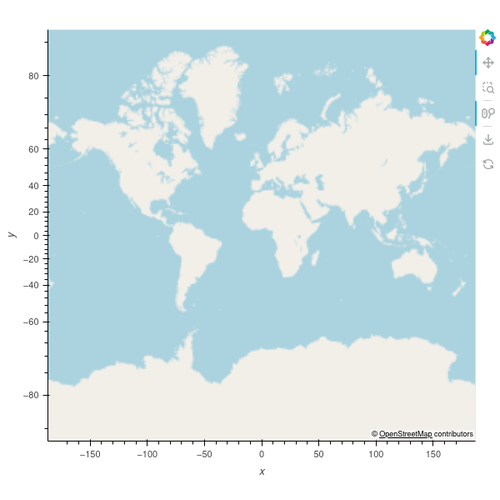
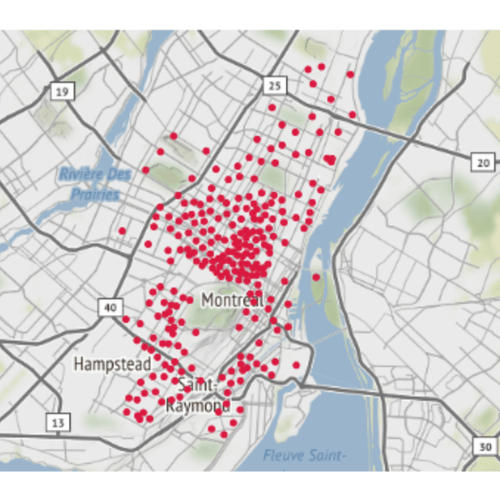
Tiles
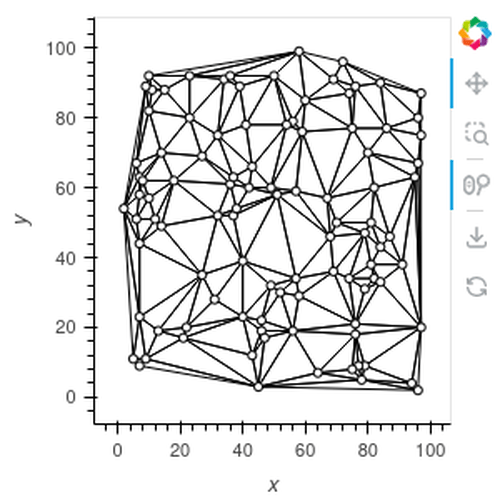
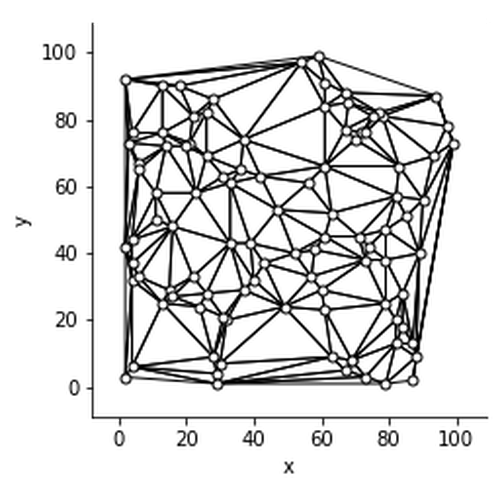
TriMesh
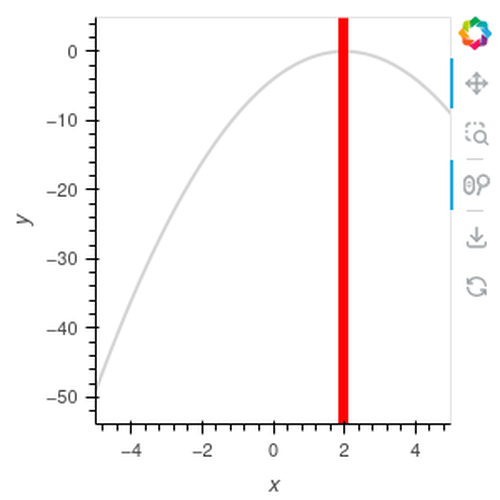
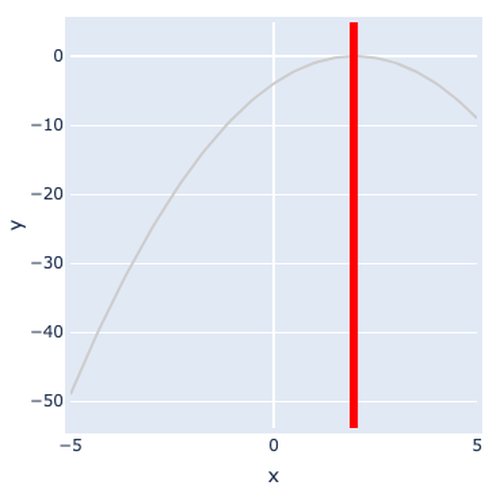
VLine
VLines
VSpan
VSpans
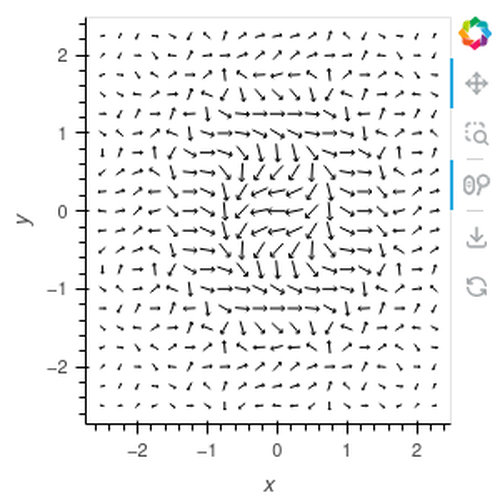
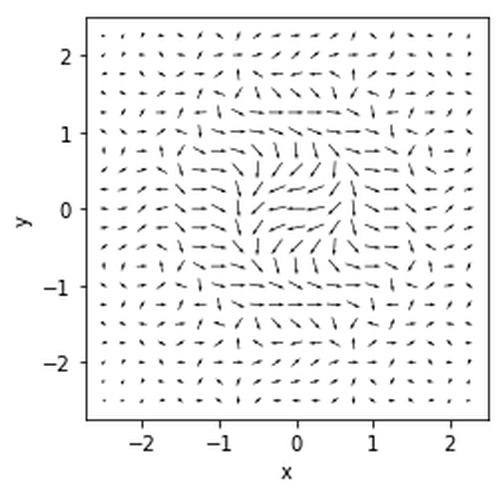
VectorField
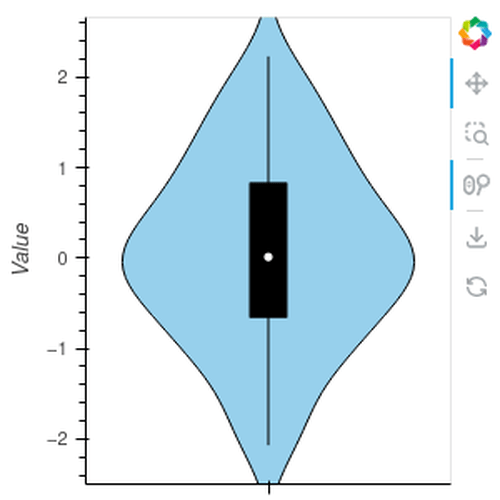
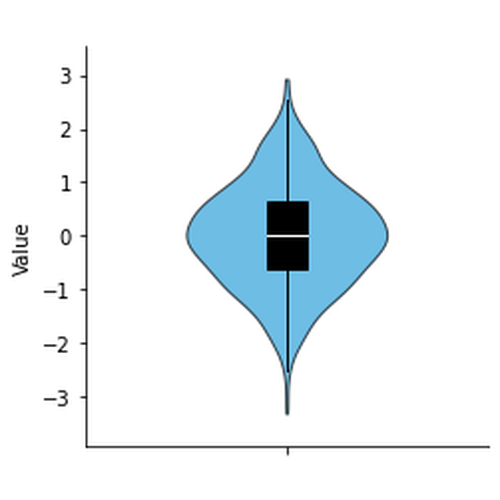
Violin
Area
Arrow
Bars
Bivariate
Bounds
Box
BoxWhisker
Chord
Contours
Curve
Dendrogram
Distribution
Ellipse
ErrorBars
Graph
HLine
HLines
HSV
HSpan
HSpans
HeatMap
HexTiles
Histogram
Image
ImageStack
ItemTable
Labels
Path
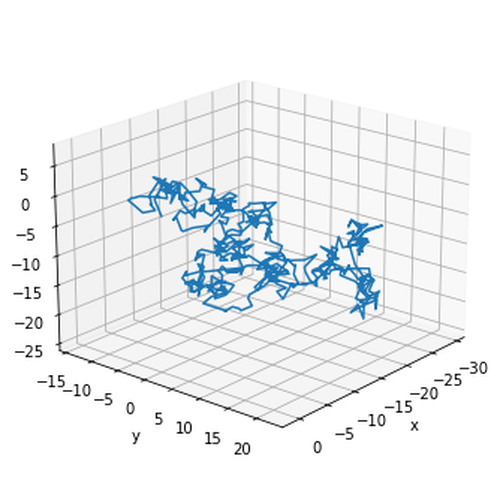
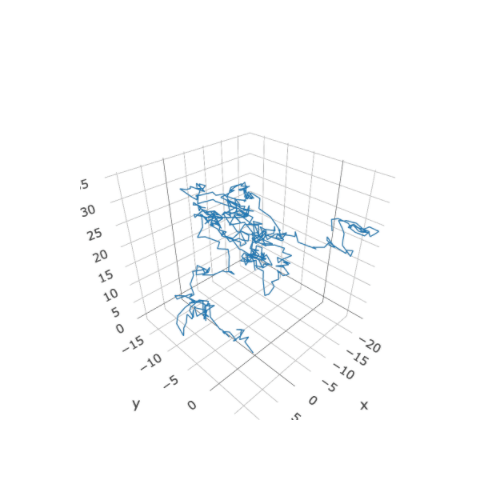
Path3D
Points
Polygons
QuadMesh
RGB
RadialHeatMap
Raster
Rectangles
Sankey
Scatter
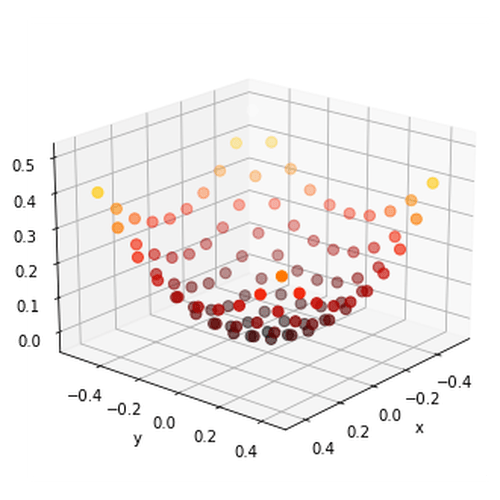
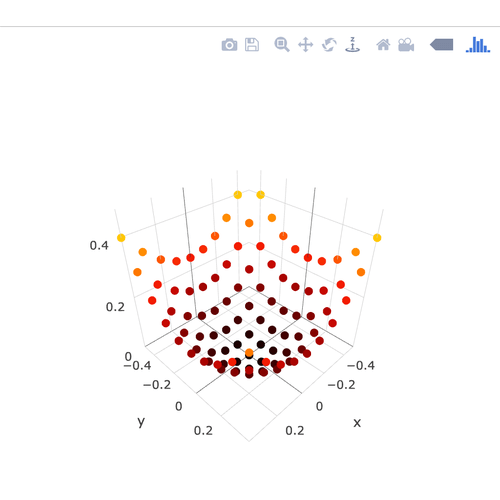
Scatter3D
Segments
Slope
Spikes
Spline
Spread
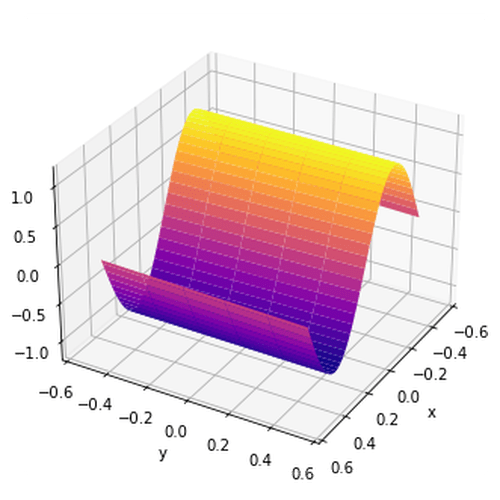
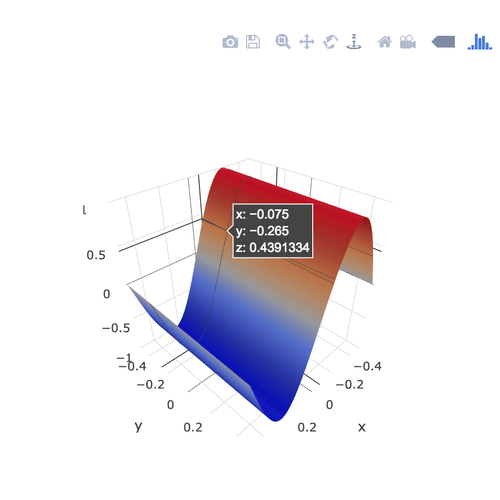
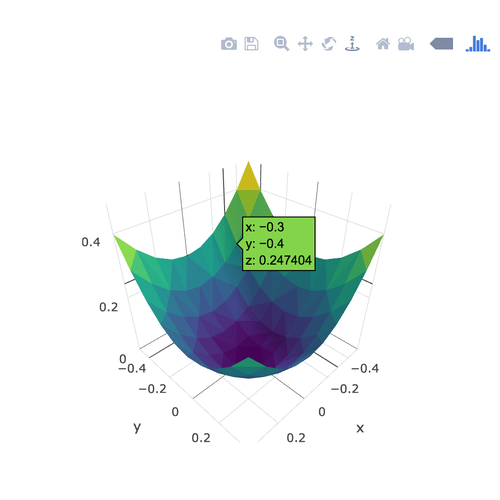
Surface
Table
Text
TriMesh
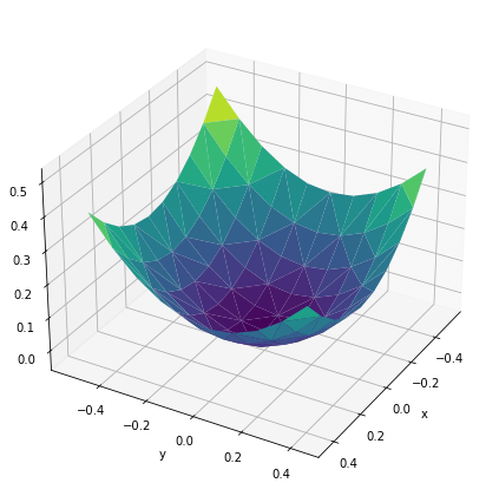
TriSurface
VLine
VLines
VSpan
VSpans
VectorField
Violin
Area
Bars
Bounds
Box
BoxWhisker
Curve
Distribution
Ellipse
ErrorBars
HLine
HSpan
HeatMap
Histogram
Image
ImageStack
ItemTable
Path3D
Points
RGB
Raster
Scatter
Scatter3D
Spread
Surface
Table
Tiles
TriSurface
VLine
VSpan
Violin
Containers#
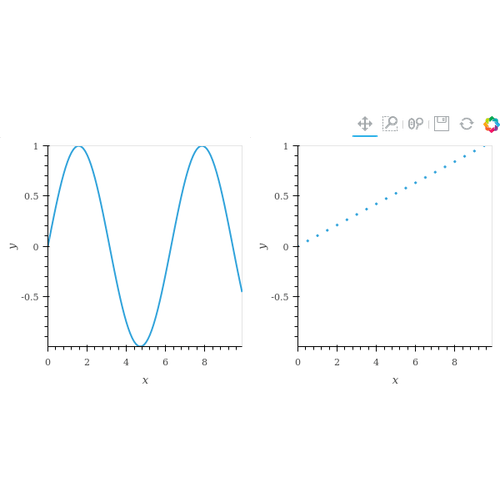
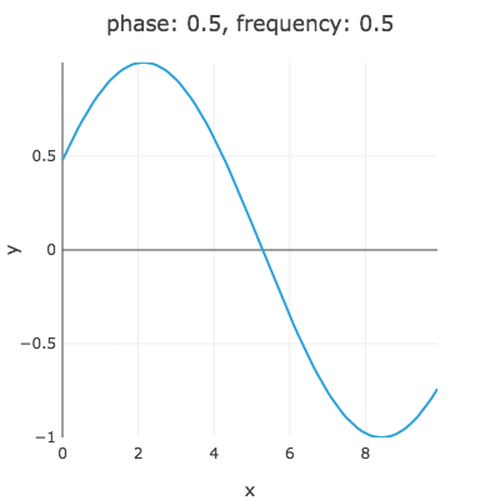
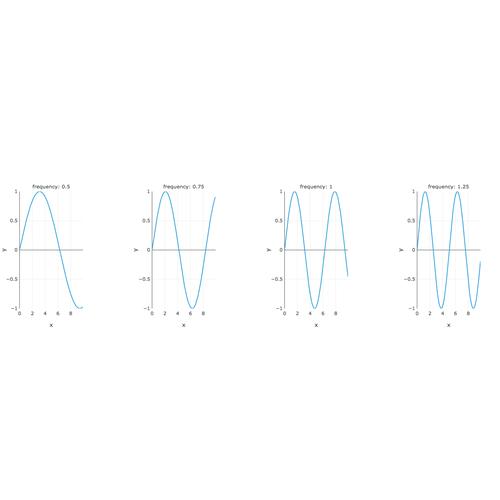
DynamicMap
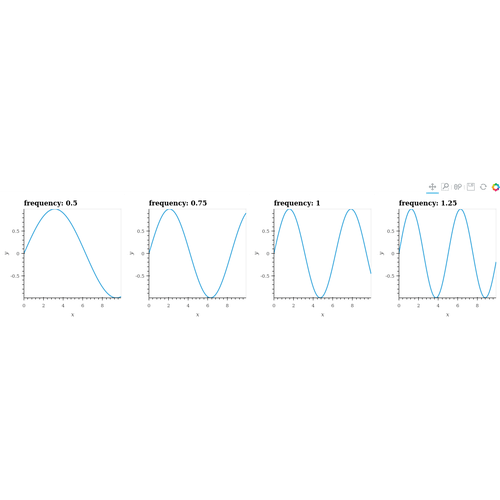
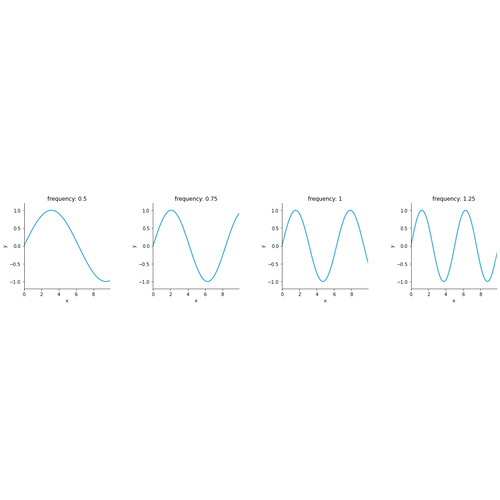
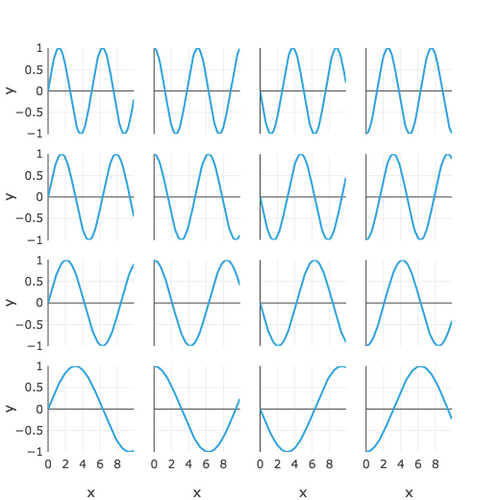
GridSpace
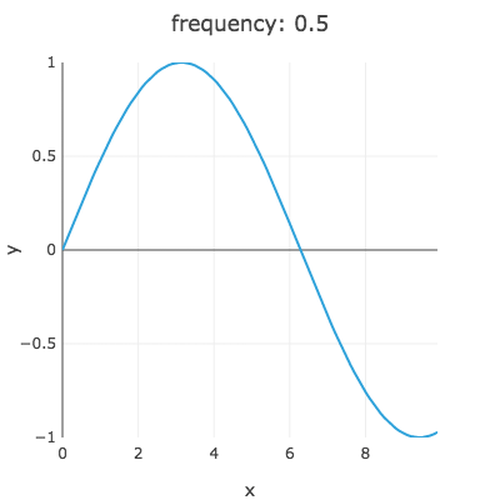
HoloMap
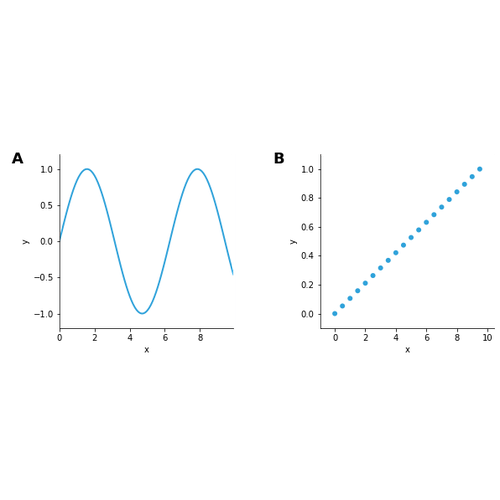
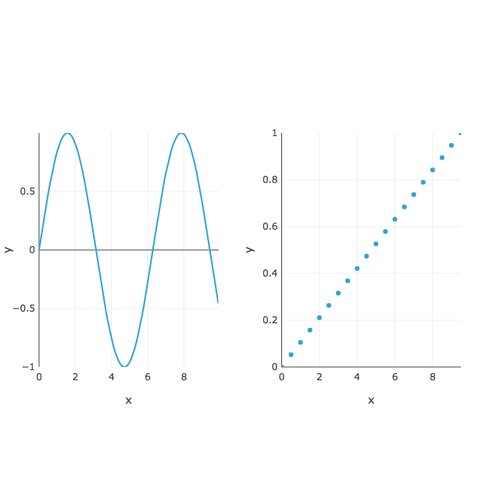
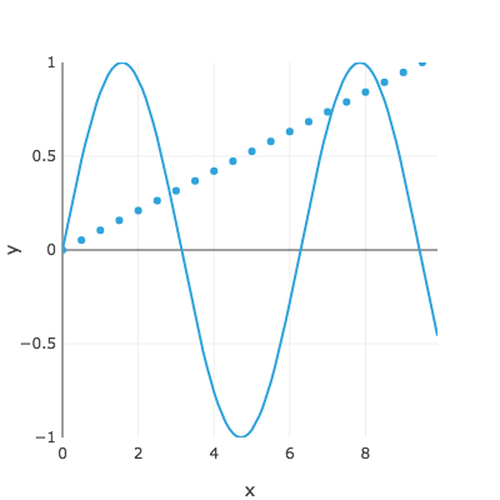
Layout
NdLayout
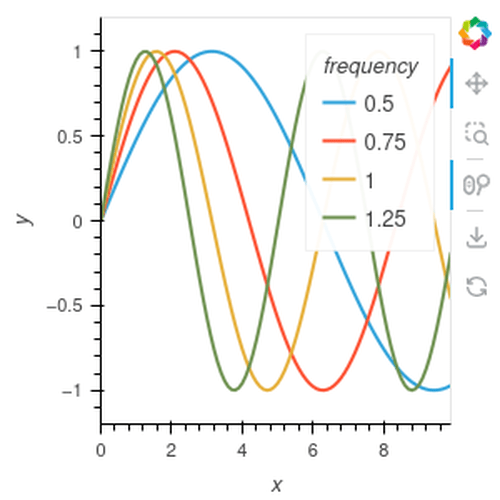
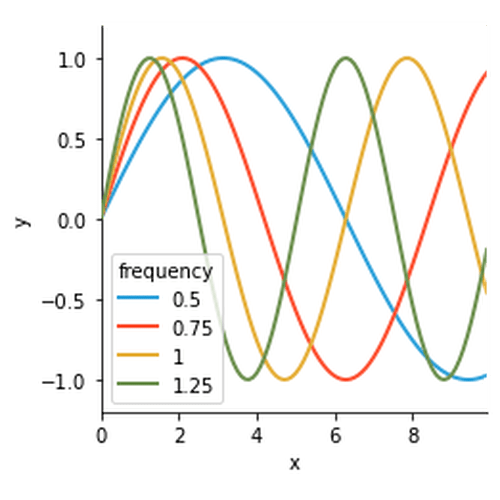
NdOverlay
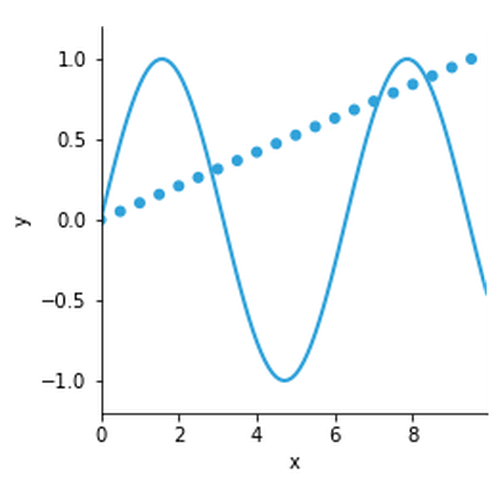
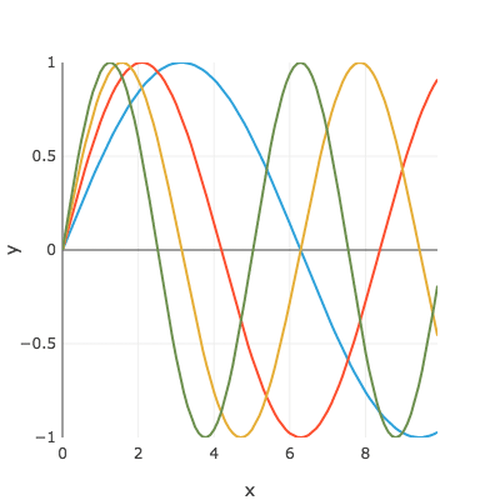
Overlay
DynamicMap
GridSpace
HoloMap
Layout
NdLayout
NdOverlay
Overlay
DynamicMap
GridSpace
HoloMap
Layout
NdLayout
NdOverlay
Overlay
Streams#
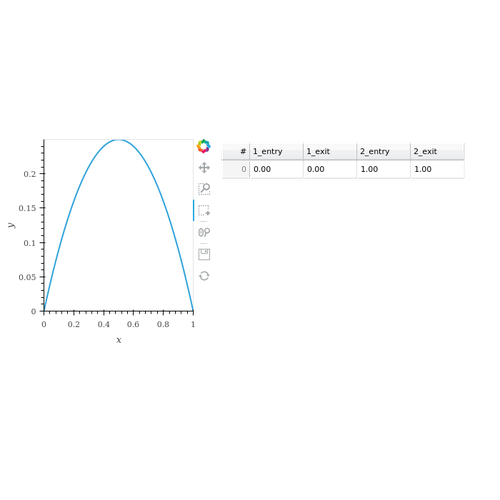
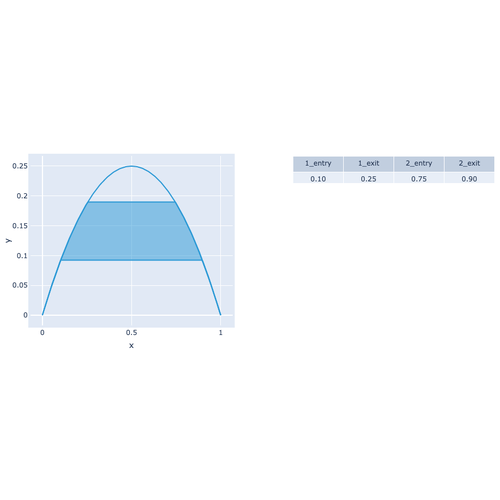
Bounds
BoundsX
BoundsY
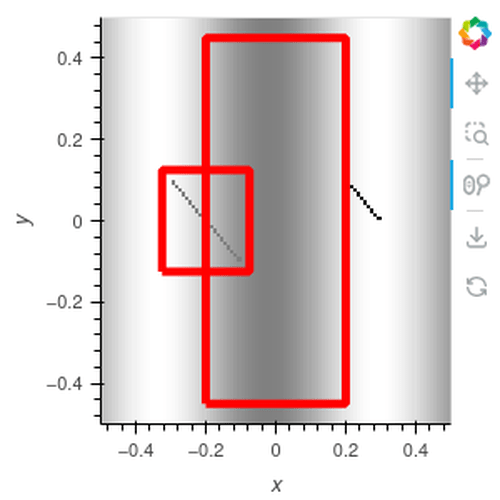
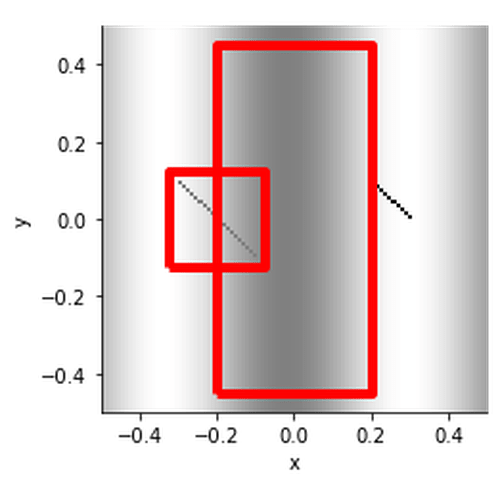
BoxEdit
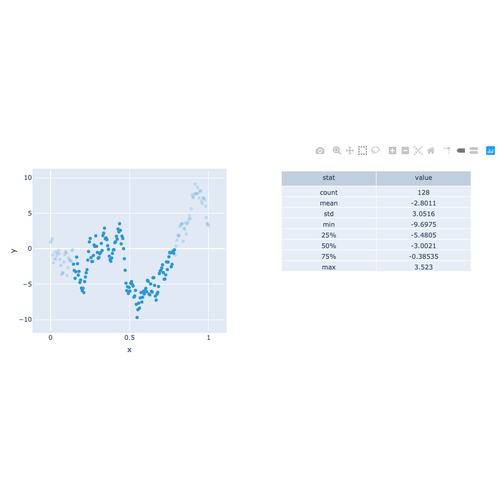
CurveEdit
FreehandDraw
PointDraw
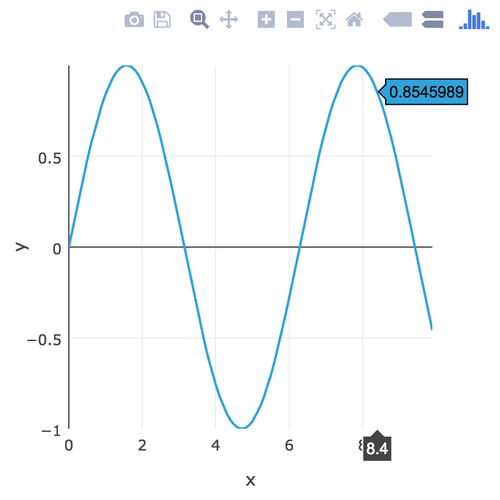
PointerX
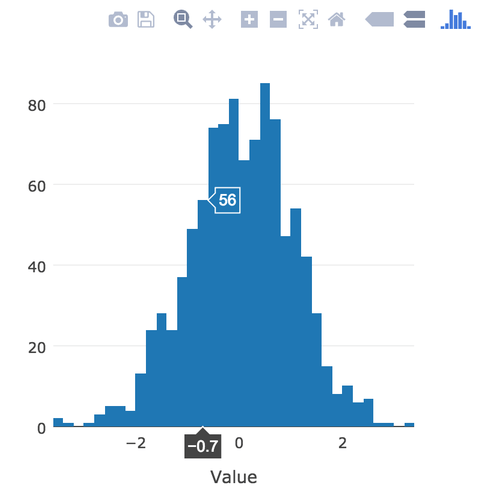
PointerXY
PolyDraw
PolyEdit
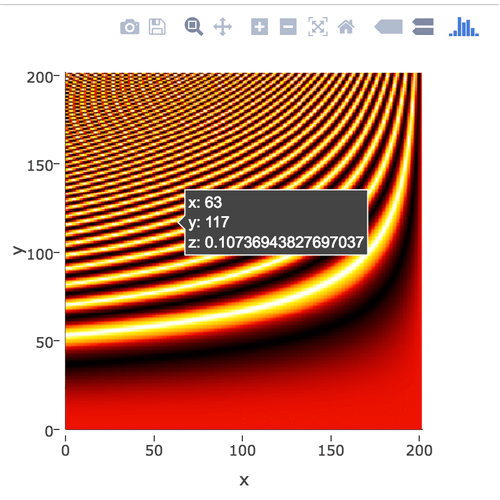
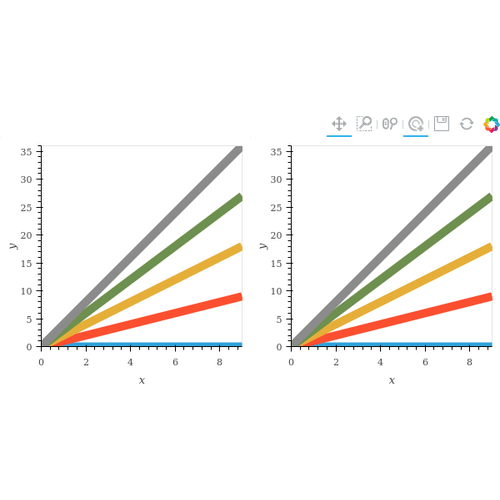
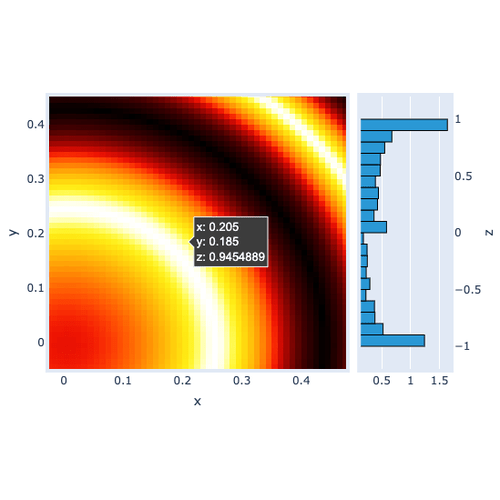
RangeXY
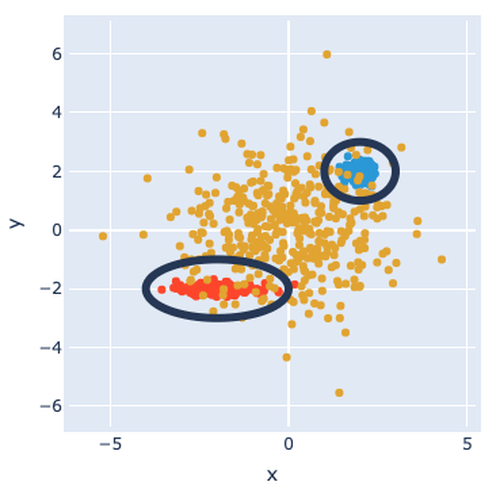
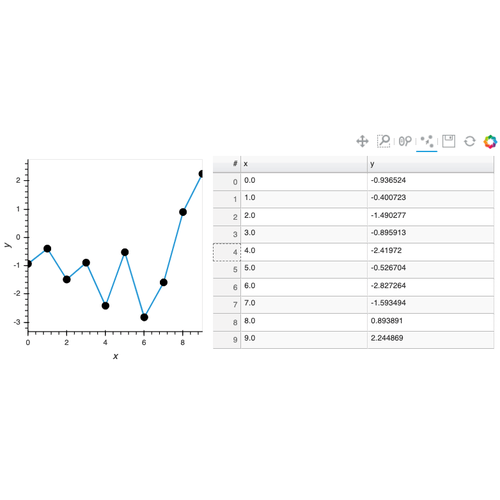
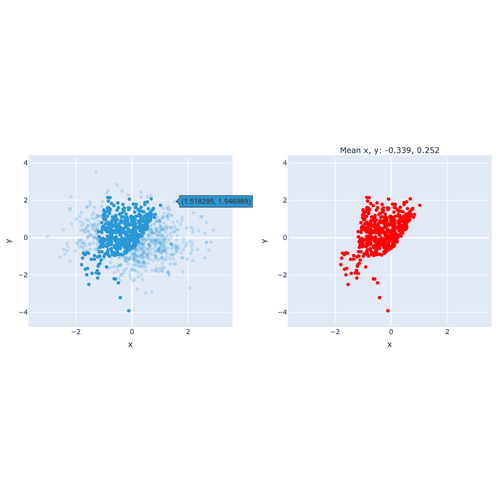
Selection1D
Selection1D Paired
Selection1D Points
Selection1D Tap
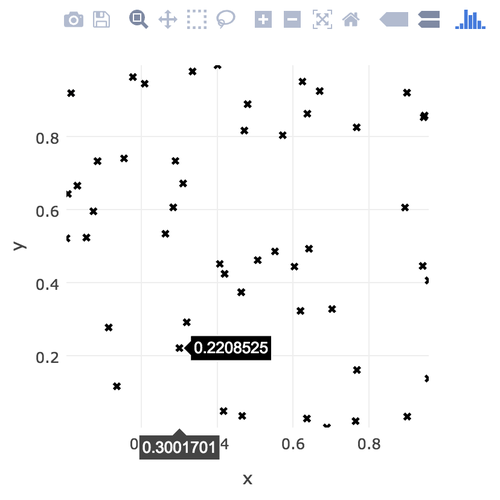
Tap
Bounds
BoundsX
BoundsY
RangeXY
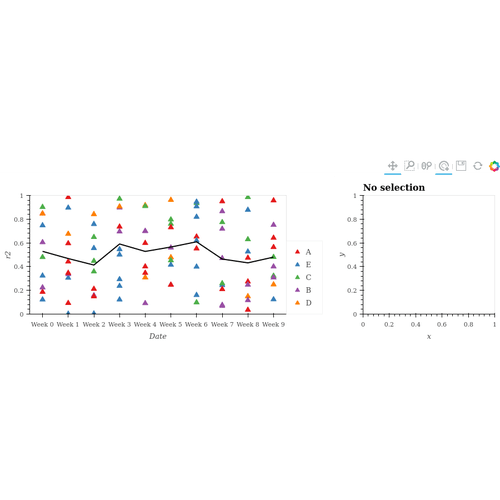
Selection1D Paired
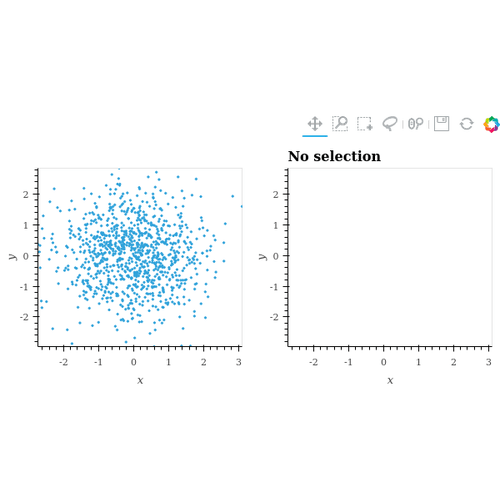
Selection1D Points
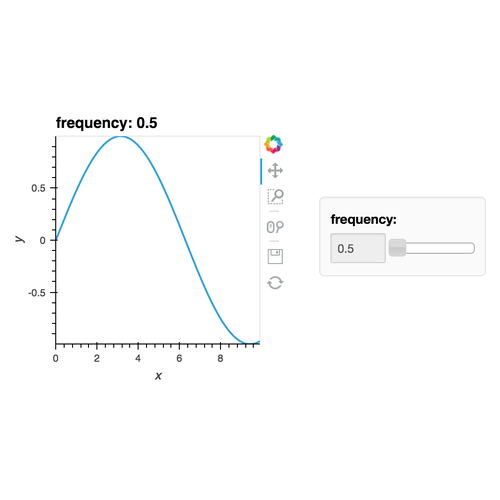
Apps#
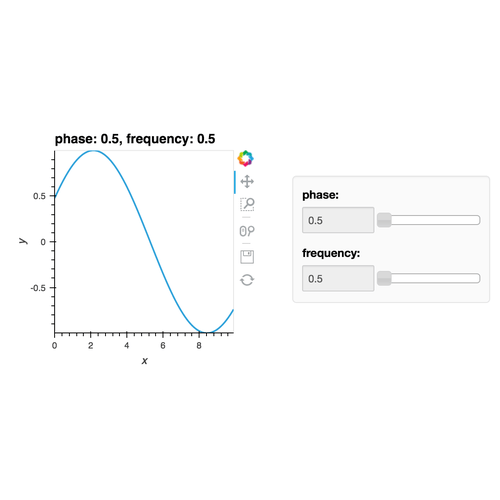
Player
Selection Stream
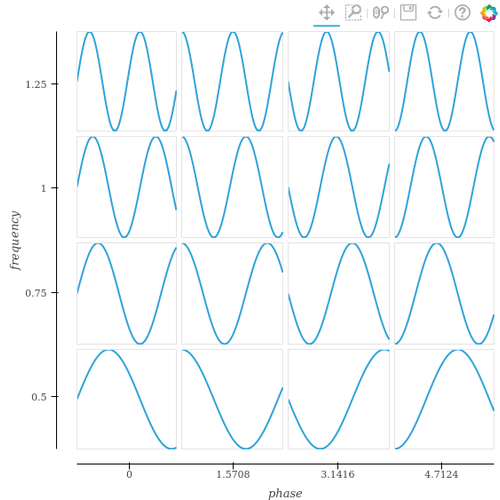
Sine
Features#
Scalebar
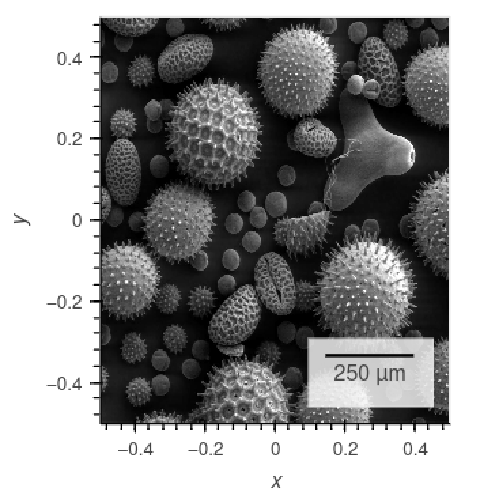
Sizebar